


RFM Analysis stands for Recency, Frequency, and Monetary Value and is a game-changing technique for understanding and measuring customer engagement.
Smart marketers use RFM analysis to nail customer segmentation, and you can too. Better segmentation leads to more targeted marketing campaigns and higher ROI.
In this post, we will dive deep into what RFM analysis is, why it’s essential, how to measure it, and how you can leverage it to enhance your marketing strategy and boost customer loyalty.
What is RFM Analysis?
RFM analysis is a tried-and-true method for customer segmentation. It’s a big deal in customer engagement marketing because it shows you a customer’s lifetime value, retention, and engagement value.
RFM segmentation groups valuable customers into specific categories and targets each customer group with marketing campaigns tailored to their engagement level.
To elaborate on the acronym:
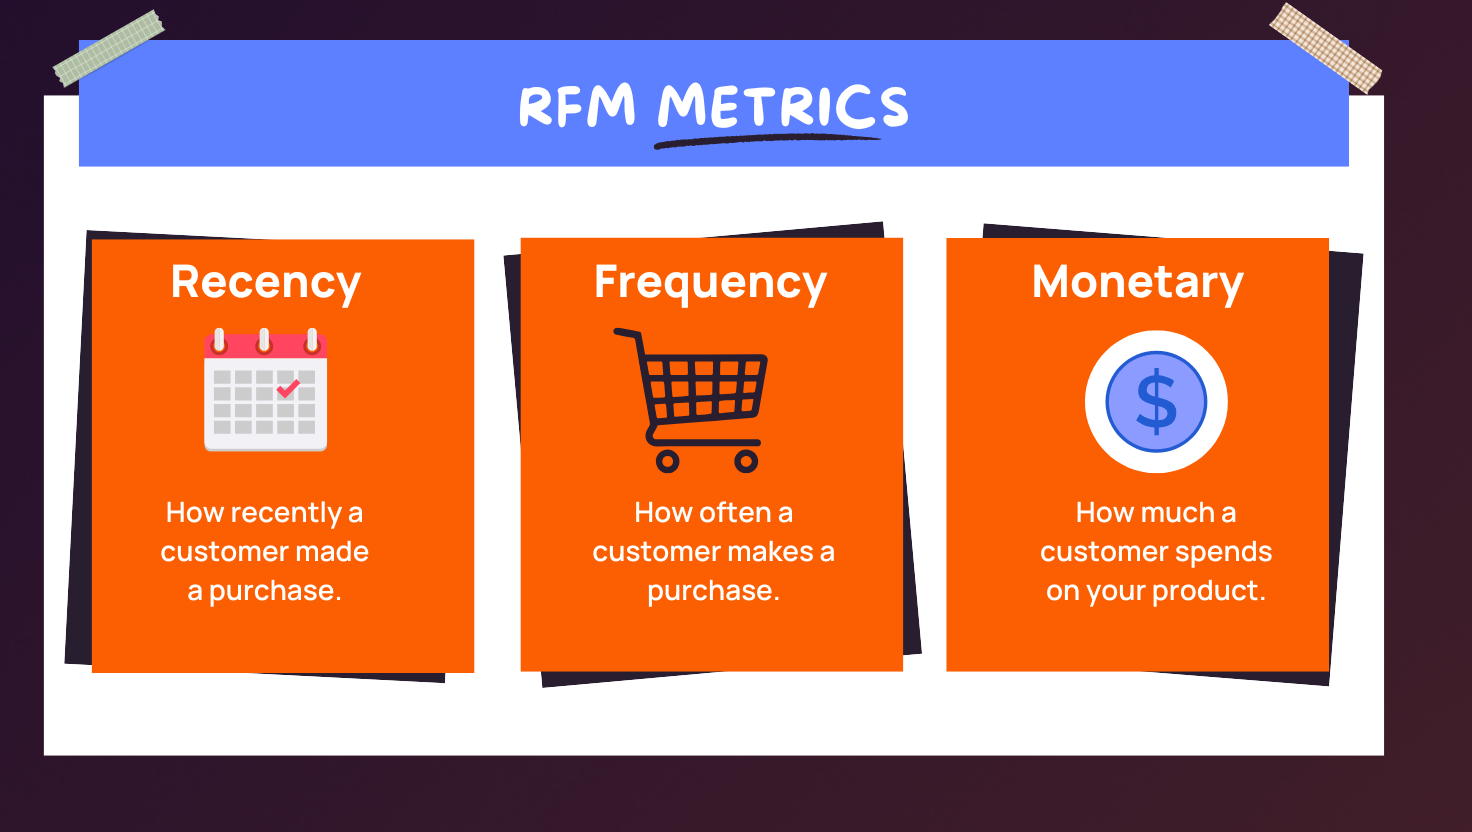
- What is Recency (R) in RFM Analysis – Recency indicates how long it’s been since a customer made a purchase. A high recency score suggests that customers perceive your brand positively and tend to purchase more frequently. Recency can be scored by grading customers on filters such as bought in the last 7 days/14 days/1 month/3 months, depending on the nature of your business.
- What is Frequency (F) in RFM Analysis – shows how often customers order from your store. It can be scored by grading on filters such as bought every 6 months/once in 3 months, and so on, depending on the nature of your business.
- What is Monetary value (M) in RFM Analysis – shows how much money a customer has spent on your business. Monetary value scores can be graded on filters, such as spending more than Rs.5,000/30,000/50,0000, depending on the nature of the business.
RFM analysis helps you create laser-focused, effective marketing strategies that are goal-oriented by answering key questions about your customers, such as:
– Who are my most loyal customers?
– Who are my highest paying customers?
– Who are my one-time customers?
– Who are my high-risk customers?
– Which customers are likely to increase your churn rate?
Here’s how you do it:
- Set a threshold for each parameter (Recency, Frequency, and Monetary value) based on your business.
- Give high points to recent buyers, frequent buyers, and big spenders.
- Combine these points to get their RFM score.
For example, someone who recently bought, buys often, and spends a lot will have a high RFM score. Use these scores to target your campaigns and boost engagement. We’ll explain this better with an example below.
How Does RFM Analysis Work? – Explained with an Example
Unlike demographic or psychographic segmentation, RFM analysis categorizes your audience based on purchase behavior. It focuses on how your customers shop, not who they are, making it a more actionable approach for driving sales strategies.
To get a better grasp of this, let’s look at an example. Imagine analyzing customer data from the last few months. The RFM table might look something like this:

Let’s begin with assigning scores on recency (R) first, as shown in the table below:

As you can see, we’ve sorted customers by recency, with the latest purchases at the top. Each customer gets a score from 1 to 5 (5 being the best). The top 30% of customers get a 5, the next 25% get a 4, and so on.
You can do the same scoring for frequency (F) and monetary value (M) on a scale of 1 to 5, just like we did for recency. Here’s how it looks for your reference.

Frequency Score

Monetary Score
How to calculate the RFM Score?
Now, combine all the scores from the R, F, and M scores cells and average out the scores to get the RFM score. The RFM score done below is the average of the individual score by giving equal weight to each attribute.

Additional note: In the example above, we have given equal importance to all three attributes (RFM segmentation) for calculation purposes. However, in real-life scenarios, different industries prioritize these factors differently based on the nature of their business. For instance:
- Retail and ecommerce industries often prioritize how often customers visit and buy from their stores. This means recency (R) and frequency (F) will carry more weight in their RFM score calculations compared to monetary value (M).
- Consumer durables businesses might have fewer customer visits but higher purchase amounts per transaction. Here, monetary value (M) will hold more weight in their RFM calculations.
- Media platforms like Netflix and Amazon Prime value how frequently customers use their services. Therefore, frequency (F) will be given higher importance in their RFM scoring.
Adjusting these weights according to your industry helps create a more accurate picture of customer engagement and purchase behavior, leading to better-targeted marketing campaigns and improved customer retention.
How to Interpret the RFM Analysis?
Continuing the example, now that we have the final RFM scores, we can derive several key insights from the calculations above, such as:
1. High-Value Customers
Customers with high RFM scores (e.g., Customer 1 with an RFM score of 4.3) are highly valuable. They make frequent purchases and spend a lot of money. They are your brand’s most passionate advocates and deeply trust your products.
Actionable strategies to consider: Prioritize these customers for loyalty programs and other perks such as special offers on new product launches or exclusive experiences or personalized services to keep them engaged. These tactics not only enhance the customer experience but also reinforce the decision to engage with your brand, increasing repeat purchases and lifetime value.
2. Moderate-Value Customers
Customers with moderate RFM scores (e.g., Customer 4, Customer 5, and Customer 7 and 10 with scores of 3.7) are somewhat engaged and moderately active with your brand.
Actionable strategies to consider: Create targeted omnichannel marketing campaigns across emails, WhatsApp, SMS and push notifications focused on nurturing to increase their engagement and spending. These campaigns can be tailored based on behaviors like previous purchases and interactions, offering incentives or discounts to promote repeat purchases.
3. Low-Value Customers
Customers with low RFM scores (e.g., Customer 3 with a score of 2.3) are less engaged and spend less money.
Actionable strategies to consider: Strategies can include re-engagement campaigns. It involves deeper understanding of the reasons for low engagement. Conduct feedback surveys and basis the response, tailor personalized recommendations. For instance, if pricing is an issue among low engaged customers, provide enticing offers to nudge them to make a purchase.
Each RFM segment requires customized campaigns reflecting the customers’ brand affinity. This approach is rooted in the Pareto principle, which posits that 80% of your sales likely come from the top 20% of your customers. Therefore, it’s crucial to engage every segment effectively, regardless of their RFM scores, as each represents distinct opportunities for business growth.
What are the Benefits of RFM Analysis?
RFM analysis offers several benefits to businesses, such as:
- Customer Segmentation: By analyzing purchasing behavior, RFM helps businesses identify and segment their customer base, enabling a clear understanding of who their most valuable customers are and how to tailor marketing efforts effectively.
- Enhanced Customer Loyalty: Personalized marketing messages informed by RFM analysis can strengthen customer loyalty and engagement.
- Revenue Growth: Targeting customers with highly relevant messages increases the likelihood of conversions, driving higher revenue.
- Customer Retention: RFM analysis pinpoints at-risk customers, allowing businesses to take proactive steps to retain them.
- Optimized Resource Allocation: Businesses can focus their marketing resources on high-value customers, ensuring maximum efficiency and return on investment.
- Better Customer Experience: Insights from RFM analysis enable businesses to create more meaningful and seamless interactions, fostering a sense of connection and understanding with their customers.
- Cost-Effectiveness: RFM analysis is an affordable method for evaluating customer value, making it accessible to businesses of all sizes.
Additionally, RFM analysis offers advantages over cohort retention analysis, particularly for high-frequency purchase models. It segments your audience based on multiple factors rather than just one, making it highly effective in the marketplace or ecommerce environments where your purchase frequencies and transaction sizes vary.
How Does Netcore’s RFM Analysis Help?
From the example above, scaling customers from a score of 1 to 5 will result in a maximum of 125 different RFM scores (5x5x5), with 111 being the lowest score and 555 being the highest. Imagine this happening at a scale of thousands and millions. Analyzing each customer’s RFM score and visualizing it on a large graph will be impossible. That’s where Netcore steps in.
Netcore’s customer engagement platform visualizes RFM analysis on a graph given below. This allows you to consume the data more easily and make better decisions with little effort. Moreover, instead of creating individual segments, we combined a few segments to create more understandable segments.

Learn how Careerbuilder, Vietnam’s second-largest job portal, achieved a 100% decrease in spam rate using RFM segmentation in Netcore’s CE platform.
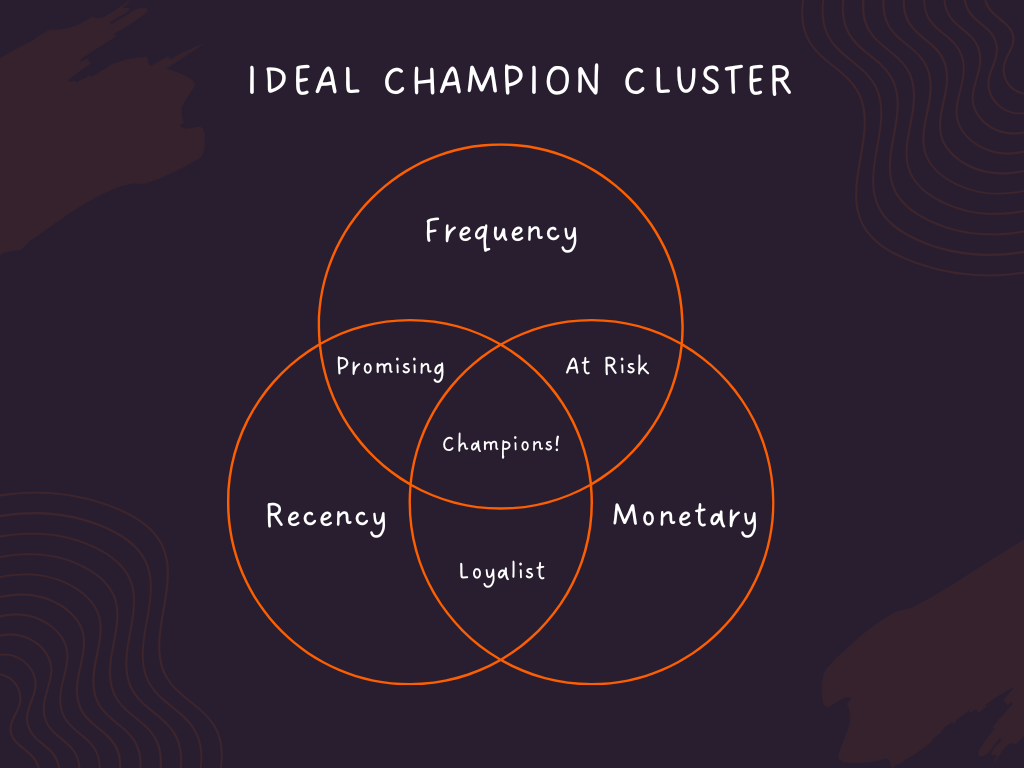
Understand RFM Customer Segmentation
From the graph above, you can notice the segments are divided into various buckets with a unique tag/name. Let’s understand what they mean.
- Need attention – These users have been active in the past but haven’t been active recently.
- At-risk – These users have below-average RFM scores and are on the verge of churning if not engaged with at the earliest.
- Dormant – These users have the lowest RFM scores and can be lost at any moment.
- Loyal – These users have engaged multiple times and have the potential to become loyalists very soon.
- Unsure – These users have above-average RFM scores but are unsure of being converted to loyal or going dormant. They require nurturing to keep them active.
- Hesitant – These users have above-average frequency but low recency. They are strong candidates to re-engage.
- Rising stars – These users have a strong frequency score, and the recency score is picking up.
- Novice – These users are your most recent users with low-frequency scores. These customers need to be encouraged to make a repeat purchase.
Understanding these segments allows you to tailor your strategies to meet each group’s needs and boost overall engagement.
How to use RFM Analysis in Business Strategy?
1. Choosing the Right Channels
After conducting RFM modelling, you better understand what your customers want and when they will likely engage with your brand. Use this insight to plan your marketing across different channels like WhatsApp, email, SMS, and push notifications, tailored to each customer segment.
2. Crafting Personalized Messages
RFM analysis helps you create personalized marketing messages that resonate with each customer segment. This ensures you send the right messages to the right people, reducing the risk of annoying customers and boosting overall satisfaction.
3. Launching New Products
By identifying your top and bottom customers through RFM, you can involve your most loyal customers in product launches. This creates positive word-of-mouth, improves product perception, and increases awareness of your overall marketing efforts.
Conclusion
RFM segmentation is like the engine of your digital marketing strategy—it fuels every campaign you run across different platforms. Using RFM analysis, you can easily group your customers into similar categories and then create personalized marketing plans for each group.
Once you’ve set up RFM segmentation, you can focus on creating engaging and creative content, knowing it will reach the right audience. Ready to see RFM in action with your own data? Book a demo with Netcore today to see it in action.


