


You have an excellent app that continues to roar up app store rankings, racking up an impressive number of downloads over a period of months. A steady user acquisition rate is resulting in increased engagement and monetisation. But, there’s still a segment of users that continue to churn, despite your best efforts!
You have an immense amount of data at your disposal. But, you’re unable to derive any meaningful insights under this deluge as your app user base continues to become more diverse and fragmented, interacting with your app in different ways and at different times.
Sounds familiar?
This is every mobile marketer’s head-scratching, forehead-frowning, hair-raising challenge!
Smartech’s Single-Step Actionable Analytics alleviate these pain-points with dynamic Cohort Analysis.
What is a Cohort?
A cohort is a group of users who share some common criteria. For example, consider Shopcore, an e-commerce retail fashion app.
A daily cohort of users can be defined as a group of users who have launched Shopcore first time and revisited it in the next ten days. Or a monthly cohort can be set for a group of users completing a purchase in a given month.
In Cohort Analysis, you can compare such groups, observing their performance over days, weeks, or months. This enables you to find the trends and movements that are otherwise hidden. Instead of analysing the behaviour of the broad user base, doing it for a small group of users, over a period for one specific activity, feature or behaviour makes it easier to understand patterns, derive conclusions, and formulate engagement and retention strategies.
You can have two types of cohorts:
1. Acquisition vs. Retention Cohorts: Groups divided based on when users downloaded and signed-up on your app. These help in analysing the retention of your users from their initial start point.
Here’s a look at a typical Acquisition Cohort.
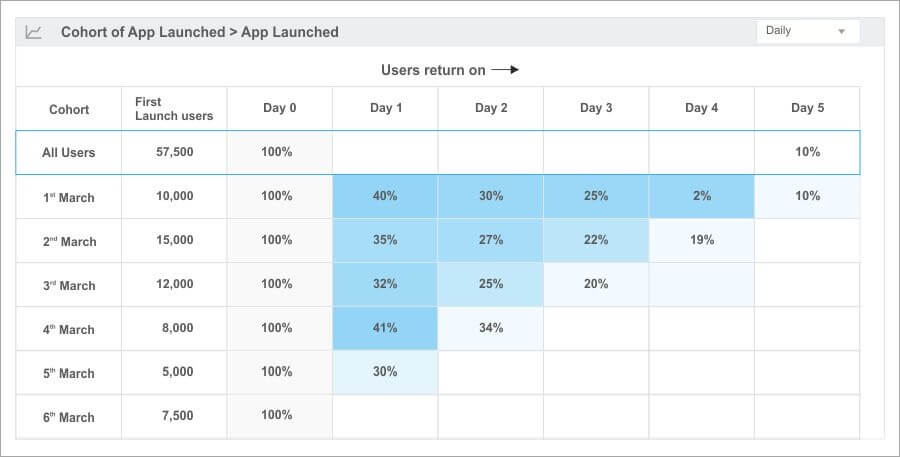
Based on the data presented, you can see that:
- Of all the users acquired between 1st and 6th March, only 10% is retained by the end of Day 5
- Each day, there is a steady drop in the number of users coming back to the app
Comparing different cohorts can give you the pattern of how many users return to the app on Days 1, 3, and 5, respectively.
Observing the number of days that users in each cohort are coming back, you can see how healthy each cohort is, not only in the first few days but over a period of time.
Don’t stop there, though!
You can also use Cohort Analysis to improve your user retention:
- Building on the above example, you can see that a significant percentage of users begin dropping-off on Day 1 alone (more than 50%), you can deduce that your users’ might need a better onboarding experience. Not only will this help you improve your app’s onboarding flow but also enrich it by welcoming new users or helping them navigate through your app. Multi-channel campaigns using channels such as push notifications, in-app messages, and emails can be leveraged to create a more effective onboarding experience
- Not all users interact with your app in the same way. Let’s say for a health app, the regular runners may be recording their activities on the app, but they may not be using the premium feature like paid consultation. Let’s say, for Shopcore, some users are frequent buyers but are not high value. And there are the ones who make one-or-two purchases a month but buy top value products. So, if you analyse the cohorts of regular buyers, you can derive conclusions like:
- Do the regular buyers have a higher retention rate?
- Are these users contributing in the revenue generation?
Pretty simple, right?
It is!
While Acquisition vs. Retention Cohorts help you determine the “who” and the “when”, Behavioural Cohorts enable you to delve deeper into the “why”.
Related blog: Customer segmentation made easy with Smartech’s Smart Segments
This means that while you’ve been able to establish timelines on which users drop-off and eventually churn, you can now understand why that’s happening.
2. Behavioural Cohorts: Groups divided based on user behaviours and actions in your app over a given time frame, for instance, within the first seven days of app install.
Here’s a look at a typical Behavioural Cohort:
Consider a group of users who abandon the cart and study their behaviour over the next five days.
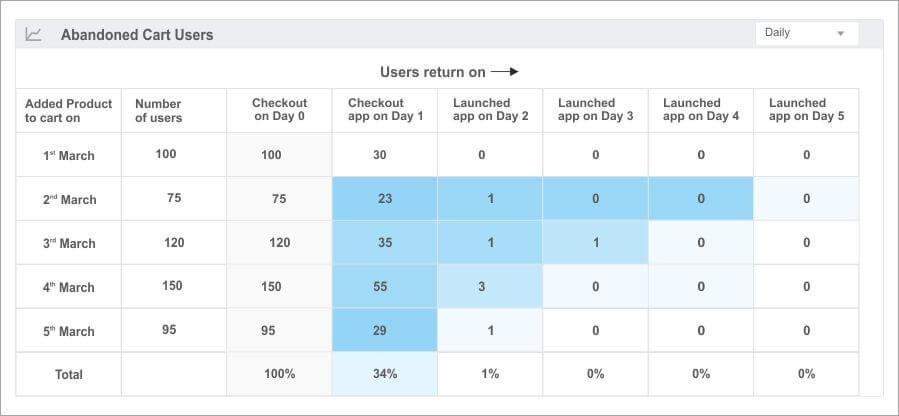
The chart shows that almost all users complete a purchase on the day they add the product to the cart. And once abandoned, less than 60% of them come back to the app.
So, all the retargeting efforts must be put right on the day the users abandon the cart.
Send a special discount coupon or a limited-time offer via channels such as triggered push notifications, emails, or SMS and bring them back before they’ve churned over completely.
Improving User Retention through Acquisition Cohorts
Let say, as Shopcore’s owner, you are aware that around 10% of your users churn every day.
You have the data, but what next?
You can then create cohorts of users who sign up on the same day.
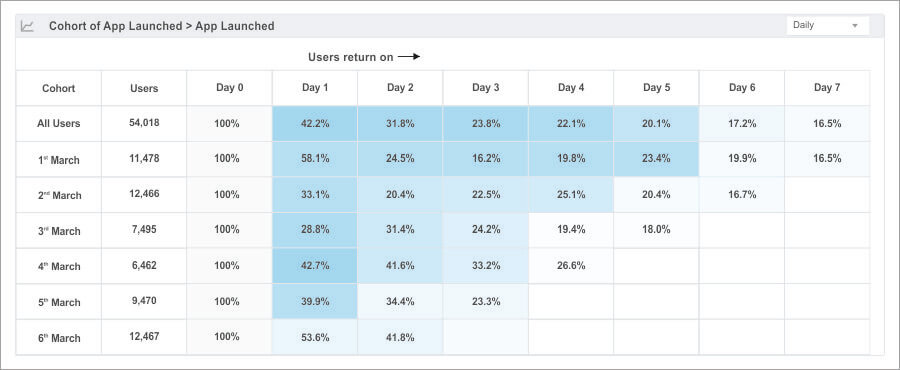
You can see that 54,018 users signed up for your app on 1st March. Day 1 retention was 42.2%, Day 3 retention was 23.8%, and Day 7 retention was 16.5%. So, on Day 7 after app-launch, at least 1 in 5 users who signed up on 1st March was still an active user in the app.
The best way to visualize this data is to turn it into a Retention Curve, which shows your retention for these cohorts over time. When you chart your data like this, it becomes incredibly easy to see when users are abandoning your product.
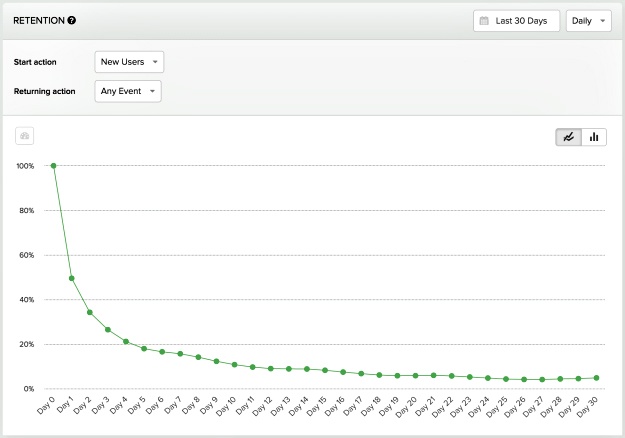
This retention curve immediately tells you that more than half of all users stop using the app after the first day. After that initial large dip, there is again a steady drop on each subsequent day.
Isn’t this an important conclusion to draw?
A curve like this indicates that users aren’t getting the core value out of the app quickly enough, and hence they are leaving. So, you now know that you need to improve the early app experience to ensure that your users don’t drift away.
Maybe an onboarding offer or a welcome series campaign.
Understanding User Behaviour Helps Elevate User Retention
From the time users sign up with your app, they interact with it in multiple ways which finally lead to their decision of staying with you or leaving. These behaviours maybe using or not using certain features, interacting with a specific type of push notifications or in-app messages.
Shopcore can create different user cohorts from the following actions: first purchase, the channel they came from, the coupon that activated them.
You want to analyse the retention of users who use a particular first purchase coupon in the app.
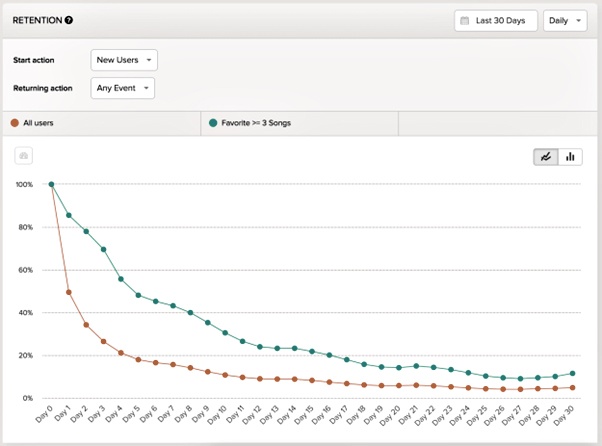
While 50% of all users churn within one day of using the app, only ~15% of users, who make their first purchase on day 0 churn out after day 1. There could be something about your first purchase offers that make the users stay.
That’s an interesting derivation to look at. To enhance the retention, you may consider introducing repeat purchase offers that hook the users to your app.
Cohort analysis enables you to dive far deeper into your user data and come up with insights that are critical and not masked by growth. It gives you answers to why as well as who, so that you can easily find answers to whats. Only by doing so, you can have a truly comparable base to optimize for growth that is sustainable.
To know more about how Cohort Analysis can help you improve your app user engagement and retention, and bring down the churn rate, schedule a demo with us today!
