


Did you know there are more smartphones than people in the world?
Smartphones have become a hub for information, social connections, and even moments of distraction. The real challenge is not getting users to download apps but keeping them engaged.
With close to 3.3 million Android apps and 1.9 million apps on the iOS App Store, the competition for attention is fierce. And the apps that can consistently engage customers and build lasting relationships with them are the real winners.
Why is engagement so critical? Amidst the digital boom, 25% of users abandon an app after just one use, and 56% uninstall apps within the first week. Engagement doesn’t just drive loyalty; it fuels revenue growth and brand advocacy. Gaming apps, for example, are projected to exceed 150 million downloads by 2027, with sustained engagement being the key differentiator between thriving and fading in a crowded marketplace.
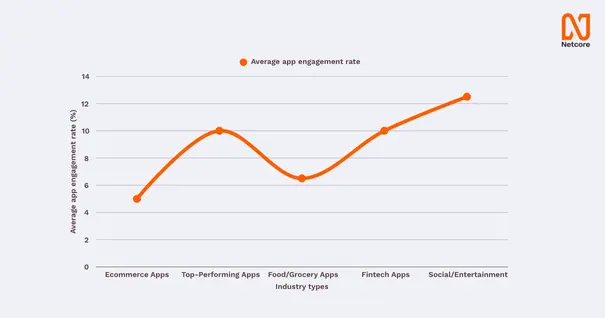
What Are the Benchmarks For App Engagement?
Typically, app engagement varies from industry to industry, though as per Adjust’s 2023 benchmarks, ecommerce apps have an average Day 30 retention rate of approximately 5%. Let’s understand app engagement rates across different industries, refer to the below image.
Why is App Engagement Important?
For ecommerce brands, especially those that are mobile-first, app engagement is directly tied to revenue. Your app isn’t just a sales channel—it’s your digital storefront, loyalty platform, and personalized shopping assistant.
High app engagement means:
- More frequent visits → more chances to sell
- Higher retention → better lifetime value (LTV)
- Increased cart activity → higher conversion rates
- Deeper personalization → better user experience
Low engagement, on the other hand, leads to:
- High churn
- Wasted acquisition spend
- Lower ROI on marketing campaigns
In short, your app’s success = your business success. That’s why tracking, optimizing, and scaling app engagement is not just important, it’s non-negotiable for business growth.
With engagement being a major differentiator, we outline 10 strategies to improve your mobile app engagement that will keep users coming back for more.
Why Should You Focus On Mobile App Engagement Strategies?
With over 7.34 billion smartphone users predicted globally in 2025, the app market is only growing, with immense opportunities for businesses to build direct, personalized customer relationships. Here’s how it helps your business:
1. Enhanced Customer Retention
Optimizing your app with proven mobile engagement strategies is crucial for enhancing customer retention. According to research, the average app loses 77% of its daily active users within just three days of installation, and by day 30, the retention rate drops to a mere 5.7%. However, by implementing personalized in-app messages, your user retention rates can reach between 61% and 74% within 28 days of receiving the message.
2. Higher Revenue Potential
When users are truly engaged, they’re more likely to subscribe, make in-app purchases, or interact with ads—directly boosting your revenue. A great in-app experience builds trust, strengthens customer relationships, and opens doors to new growth opportunities for your business.
3. Create Brand Advocates
There’s no better way to promote your app than turning your customers into loyal advocates. Engaged customers are four times more likely to spread the word about your app to their peers, helping you cut costs on acquiring new customers.
4. Improves App Store Performance
App Store algorithms favor apps with high engagement and download rates. Apps with better engagement see higher ratings, reviews, and better rankings in the App Store, guaranteeing your app is easily discoverable on the platform.
5. A Goldmine of Information
Your engaged users spend a significant amount of time on your app, giving you access to a goldmine of valuable data. Over time, this data can guide product improvements and help prioritize features that deliver the most value. With the right customer engagement platform, you can harness these insights to enhance user experiences and strategize your campaigns more effectively.
6. An Edge Over Competitors
Did you know that, on average, a mobile user interacts with only 30 out of the 80 apps installed on their phone? This means nearly 50 apps sit unused, highlighting how difficult it is for marketers to keep users engaged even after a successful download. In a saturated app market, simply acquiring users isn’t enough—sustained engagement is what sets successful apps apart. When you consistently retain users and demonstrate value, you gain a competitive edge that lays the foundation for long-term business growth and expansion.
Now that we understand why businesses should focus on Mobile app engagement, let’s look at the ten practical engagement strategies they can use to retain customers.
Master Mobile App Engagement: Industry-Proven Tactics Inside This Ebook
10 Successful Mobile App Engagement Strategies (With Examples)
In this section, we are going to discuss ten proven mobile app engagement strategies that work like a charm and we will also learn how to measure success around them using relative metrics (and their formulas).
1. Simplify Sign-Up
First impressions matter. An intuitive sign-up process reduces barriers to entry, allowing users to start obtaining value from your app almost instantly. Long forms, multiple steps, or confusing layouts can deter users immediately, but a streamlined process creates a seamless entry point and sets the tone for a positive user experience.
How is this measured?
- Sign-Up Conversion Rate
Measures the percentage of your website visitors that convert= ( Number of completed sign-ups/Total app downloads) × 100 - Drop-Off Rate During Registration
The percentage of users who abandon the sign up process = ( Number of Users Who Abandon the Sign-Up/Total Users Who Started Sign-Up) × 100 - Time to Complete Sign-Up
Measure the average time (in seconds or minutes) it takes for users to complete the sign-up process.
Example: Instagram
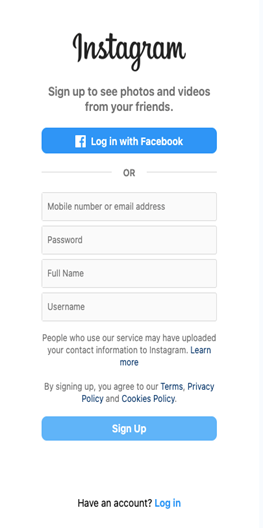
Image courtesy: Instagram
Instagram has nailed the onboarding processes by allowing customers to sign up instantly using Google or Facebook accounts. It warrants minimal effort, encouraging users to start without a second thought.
2. Effective Onboarding
Onboarding is your chance to turn a newly registered user into a loyal user. When you show customers how to derive value from your product as soon as they register, you give them a sense of accomplishment and encourage them to stick around.
How can you measure this?
- Onboarding Completion Rate
The percentage of users who start and finish the onboarding process = ( Number of users who complete onboarding/Total users who start onboarding) × 100 - Time to First Key Action
The average time it takes for users to perform a meaningful first action (e.g., sending a message, creating a task). - First Week Churn Rate
Percentage of customers who stop using the app within the first week = ( Users who stop using the app within 7 Days /Total users who installed the app) × 100
Example:
Let’s take the example of Slack.
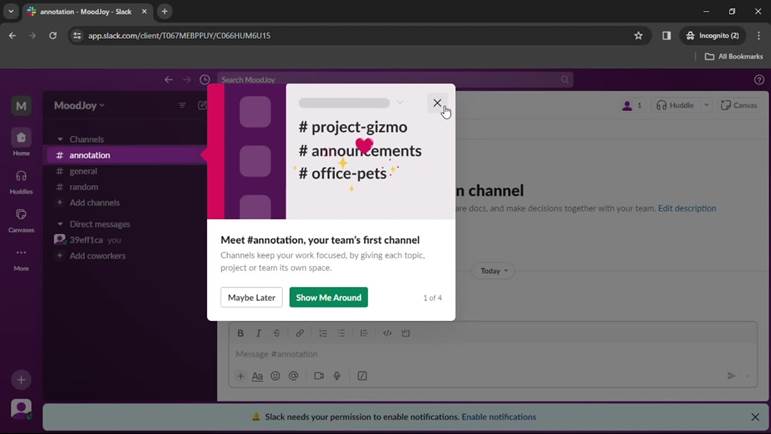
Image courtesy: Pageflows
Slack’s onboarding plan doesn’t overwhelm new users with features on the first try. Instead, it guides them through setting up their first workspace and sending their first message, ensuring they grasp the core value immediately.
3. Gamify App Usage and Experience
Gamification is all about providing an enjoyable and rewarding experience. You tap into users’ intrinsic motivations to compete, achieve, or have fun through gamification. It encourages regular usage and creates a sense of progress, making users feel more invested in the app. Research shows that gamification can boost app engagement by up to 48% and increase retention rates by 34%.
How is this measured?
- Daily Active Users (DAU)
Total number of unique users who interact with the app in a single day. - Retention Rate
The percentage of users who return to the app = (Number of returning users/Total number of app users) × 100 - Average Session Duration
The average amount of time a user spends on the app = Total time spent on the app by all users/ Total number of sessions
4. Foster Community Communication
People are drawn to communities where they can share experiences, learn, and connect. Creating opportunities for user interaction within your app creates a sense of belonging, drawing users back to your app. Users develop deep emotional connections and boost retention, actively participating in communities and becoming brand advocates.
How is this measured?
- Engagement Rate in Community Features
How much an audience interacts with content = [Total interactions (Likes, Comments, Shares)/Total users participating in community features] × 100 - Messages Sent Per User
Messages Sent Per User = Total Messages Sent/Total Active Users
Example: Flo app
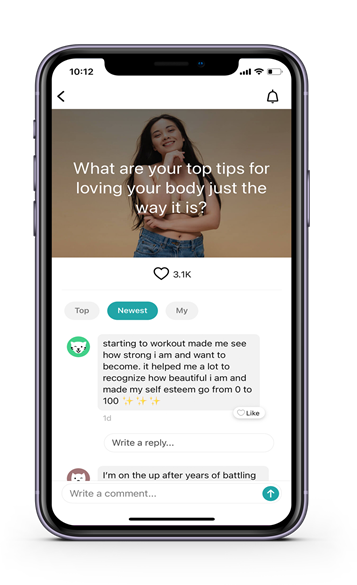
Image courtesy:Flo
Flo’s forums provide a safe space for its users (mainly women) to discuss sensitive health topics. This community-building approach makes users feel heard and connected, increasing app stickiness.
5. Provide In-App Support
Just like people, there’s no perfect app in the world. Despite its imperfections, why do some people prefer one app? These apps resolve issues quickly without prompting you to leave the app, minimizing frustration. This proactive approach enhances user satisfaction and reinforces trust in your brand.
To achieve this, many apps have integrated AI-powered chatbots that are trained on common FAQs to provide instant resolutions. These bots can quickly address repetitive queries, such as password resets or feature explanations, without human intervention. With AI-driven intent recognition, bots can go a step further by understanding the context of user issues and guiding them to relevant resources or personalized solutions before escalating the matter to live support. This speeds up resolution times, reduces customer frustration, and improves satisfaction scores.
Fast issue resolution has a direct impact on customer retention—studies show that quick and proactive customer support can increase retention rates by up to 20%. By investing in smart in-app support, businesses can turn user problems into opportunities for building loyalty and long-term engagement.
How is this measured?
- Customer Satisfaction Score (CSAT)
A metric that measures how satisfied customers are with app= (Number of satisfied responses (e.g., 4 or 5 on a 5-point scale)/Total responses) × 100 - Average Response Time
Measure the average time taken to respond to a user query in-app. - Issue Resolution Rate
Measures the customer service = (Number of issues resolved/Total reported issues) × 100
6. Use Push Notifications
Push notifications are a powerful way to nudge users back into your app compared to traditional channels like email or SMS, thanks to higher open rates and real-time visibility. They grab attention instantly, making them a great tool for driving action. Plus, you can get creative—use catchy copy, rich media like images, multiple CTAs, or even interactive elements like timers and carousels. These features not only make your notifications stand out but also encourage users to click, explore, and stay engaged with your app.
How is this measured?
- Push Notification Open Rate
Percentage of users who open a push notification after receiving it = (Number of notifications opened/Total notifications sent) × 100 - Click-Through Rate (CTR)
How often people click on notifications = (Number of Clicks on Notification/Total Notifications Delivered) × 100 - Reactivation Rate
Percentage inactive users who returned after notification = (Number of inactive users who returned after notification/Total inactive users targeted) × 100
Example: Headspace
Headspace ensures users form habits and stick with their app through gentle reminders and meditating nudges, often tailored to their schedule or past behavior.
7. Use Emails to Restart Engagement
While in-app notifications are great for active users, email is best for reactivating dormant ones. Thoughtfully crafted emails can remind users of your app’s value, showcase features they might have missed, or re-engage them with exclusive offers or updates.
With advancements in email technology, emails have become more interactive, thanks to AMP (Accelerated Mobile Pages) Emails. Unlike traditional static emails, AMP emails allow users to complete actions—such as filling out forms, browsing product carousels, or even playing mini-games—without leaving their inbox. This creates a more dynamic and engaging experience.
For instance, you can use AMP-powered interactive emails to run in-email games that reward users with incentives, discounts, or exclusive offers redeemable only through your app. This not only boosts your email marketing campaigns but also drives users back to your mobile app, strengthening engagement and creating a seamless customer experience.
How is this measured?
- Email Open Rate
The percentage of email recipients who open an email = (Number of emails opened/Total emails sent) × 100 - Click-Through Rate (CTR)
How often users click on an ad or link in relation = (Number of clicks on email links/Total emails delivered) × 100 - User Reactivation Rate
Percentage of customers who return to a business after stopping to use a product or service = (Inactive users who returned after email/Total inactive users targeted) × 100
Example:
Asana
Asana uses targeted emails to remind users of unfinished tasks, demonstrate value using an email onboarding journey, share productivity tips, or highlight new features. These communications prompt users to return and re-engage with the platform.
8. Personalize, Personalize, and Personalize
Make your users feel valued by personalizing their experience with your app. Create a more relevant and enjoyable experience by tailoring content, recommendations, and notifications to individual preferences. This builds emotional connections with your brand and keeps users engaged for high retention.
How is this measured?
- Click-Through rate
The percentage of personalized recommendations viewed = (Clicks on personalized recommendations/Total personalized recommendations delivered) × 100 - Average Revenue Per User (ARPU)
The percentage ofrevenue from personalized features = (Total revenue from personalized features/Total Active Users)
Example:
Netflix
Netflix leverages user behavior data to recommend content based on user’s preferences. It is as if Netflix can read minds. From “Because You Watched” lists to tailored genres, every interaction feels custom-made for the user.
9. Gather User Feedback
Show your users that you care about their opinions and are committed to improving their experience. Actively collecting feedback helps you understand what features users love, what frustrates them, and what needs improvement. This direct input allows you to make informed decisions about updates and enhancements that truly resonate with your audience. Also, positive feedback can be leveraged by prompting satisfied users to leave reviews on the app store, boosting your app’s reputation, visibility, and downloads.
How is this measured?
- Feedback Submission Rate
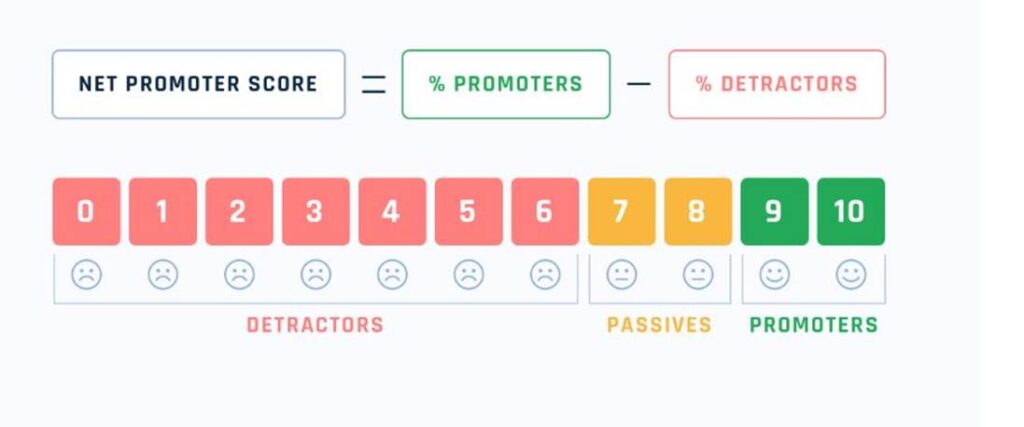
The percentage of feedback submission = (Number of feedback responses/Total feedback requests sent) × 100 - Net Promoter Score (NPS)
How likely customers are to recommend your app to others = %Promoters − %Detractors
Where:
Promoters are those who score 9-10.
Detractors are those who score 0-6.
- Change in App Store Ratings
Compare average ratings before and after implementing feedback.
Example:
Notion
Notion regularly implements user feedback in updates, actively engaging users through surveys and in-app prompts to gather suggestions. This activity builds trust and satisfaction among its audience.
10. Simplified UI Experience
A complex UI always drives users away. On the other hand, with simplified, intuitive designs, users move through your app with minimal effort. A clean UI also lowers cognitive load, which means your app becomes more enjoyable. Additionally, running A/B tests on essential pages, such as onboarding screens and key navigation flows, helps identify which design elements improve user engagement and conversion rates. By continuously testing variations, you can refine the UI to maximize usability and retention.
How is this measured?
- Task Completion Rate
The percentage of tasks users successfully complete out of the total tasks they attempt in an app = (Tasks successfully completed/Total tasks attempted) × 100 - Navigation Success Rate
The percentage of users who successfully navigate to a desired feature out of all users who attempt the navigation = (Number of users successfully navigate to desired feature/Total users attempt navigation) × 100 - Conversion Rate
The percentage of users who complete a desired action (e.g., signing up, making a purchase) in each A/B test variation:
(Users who complete the action / Total users in the test group) × 100
- Time on Task
The average time users take to complete a specific task in different test variations. A lower time often indicates better usability.
- User Satisfaction Score
Use survey results to calculate the average satisfaction rating (e.g., on a scale of 1-5).
Example:
Tinder
Tinder’s straightforward design makes it effortless for users to interact, mainly with the swipe interface, keeping them engaged for longer sessions.
Final Remark
When it comes to measuring the success of an app, it’s your loyal users rather than the total number of downloads that matter. Your loyal, engaged users help you stand out among the 5 billion apps in the market. Apps that excel at engagement don’t just survive in the app store; they thrive, delivering exponential growth in revenue, retention, and brand advocacy. As product managers and marketers, your challenge and opportunity lie in continuously refining these strategies, using customer data, and understanding their requirements. The time to act is now – your users and competitors won’t wait.


