


Product adoption is all about users discovering your product and its value, constantly using it to accomplish their goals. The result of product adoption is user retention. This makes product adoption a key metric for product teams. Product adoption helps product managers gauge the success of their products, and rightly so. You see, a typical adoption curve is an inverted bell which means with time, the active users keep reducing and stop growing after a point. And this low adoption point is the calm before churn.
The Google Play store witnessed a staggering 62.4 billion app downloads in the past year. However, the retention rate for apps in different industries ranged from 27% to 43% for 30 days. By the 90 day mark, the retention rate was down to 25%. These declining numbers can be tied back to poor product adoption rates. In fact, product adoption significantly impacts almost all key growth metrics, including CLTV, CAC, conversion and engagement.
For every change you bring to the app, for every new feature you launch – measure the right product adoption metrics for your mobile app to know better how users engage and interact with your app. This means going above and beyond the basic question: Is the app being used?
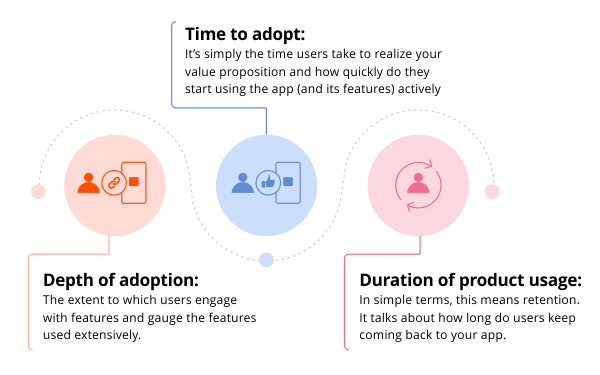
Now, product adoption metrics may vary from app to app. But the bigger picture remains the same for every app: Knowing the what, when and how long of product adoption. This means understanding the time to adopt, adoption depth, and product usage duration.
Let’s now go through the top metrics covering all of the above factors of product adoption:
1.Time to first action
The time to first action metric signifies the average time a new user takes to complete a significant action or an existing user to use a new feature. Time to first action predominantly indicates how quickly the users adopt your product. From another viewpoint, it measures how much time the user is spending on your app without adopting the new features.
To optimize the time to first action, focus on helping your new and existing users become aware of the latest and critical features. The best way to achieve this is through effective contextual onboarding and walkthrough journeys.
Below are a few strategies to uplevel your contextual onboarding:
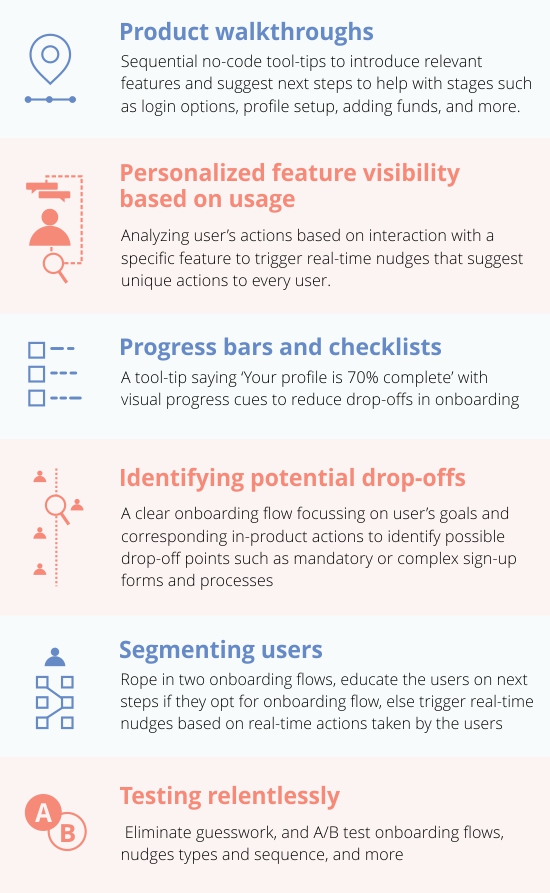
Done right, you’ll be able to guide your users in the right direction and significantly reduce the time to first action and help users reach their ‘aha moment’ faster.
Explore more app onboarding strategies in this ebook: https://netcorecloud.com/ebook/best-practices-for-app-onboarding/
Our no-code platform helped Gradeup personalize the quick links for the pages based on the users’ exam preferences. We also floated an onboarding video and quiz to its new user base with the help of specific IDs for this video. And if the user still hadn’t completed the video, we used the smart nudge feature to highlight the videos during the various points of the user’s onboarding journey. This effective onboarding resulted in significant growth in Gradeup’s feature adoption, course completion, and user engagement.
2. Percentage of users that performed the core action for the very first time
While the title is self-explanatory, a lot goes into making this one of the most successful product adoption metrics. Yes, this shows you the exact percentage of users that performed the core action for the very first time, but what do you mean by the core actions?
The app’s most critical and defining action is termed the core action. Naturally, it is different for different apps. The core activities of an eCommerce app, for example, could be filling in profile details or adding products to the cart. Similarly, for a travel app, it would be checking out flights.
You can start optimizing this metric by identifying the core activities of your app. Once done, thoroughly analyze user behaviour and further employ product analytics to understand the potential friction points (that prevent your user from completing the core action) to fine-tune them.
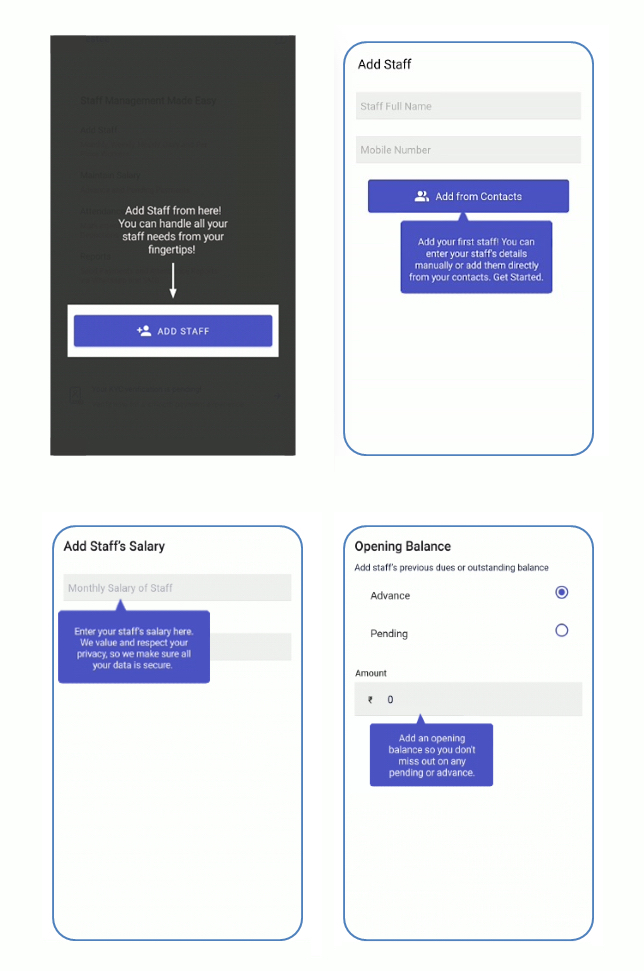
For Pagarkhata, an employee management app, one critical action was adding staff details. This vital action was also where the users faced significant friction as there was resistance to fill in the details that resulted in low product adoption. To solve this, we ran an A/B test. In the first variant, we used various tool-tips nudges to push the users to complete the core activities during the walkthrough. The second variant also worked in a similar fashion but was coupled with spotlight nudges. Comparing both the variants, the number of users adding their staff details increased an average of 3.4 times.
3. Conversion
The conversion rate measures the number of people who interacted with the app compared to those who actually did the core action. For an e-commerce app, for example, conversion may mean users signing up, while for a travel app, conversion may mean flight booking.
A low conversion rate indicates that your user cannot see value in your app or is taking too long to interact with it.
How do you undo this and achieve high conversion rates? By nudging the right users to take the right action at the right time and helping them realize the app’s value. User path analysis plays a significant role in driving conversions. It enables you to visualize the most common conversion journeys across your website/app. By focusing on how different user segments progress between various conversion events and the time taken between each of these, you’ll be able to identify friction points successfully. You can further eliminate these churn points to bring users back to the app.
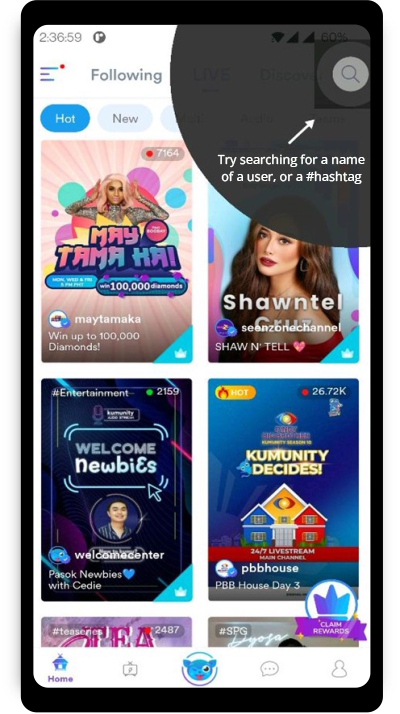
Kumu’s (A Filipino social entertainment app) users found it challenging to use its new search feature to find the relevant content, resulting in low conversion and product adoption. We strategically leveraged the spotlight nudge feature on the search icon to encourage users to use the feature actively. After implementing this solution, Kumu saw a 38% increase in their feature adoption.
4. Customer Lifetime Value
Customer lifetime value (CLV) is a metric that predicts how much revenue a single customer will bring to the company over their lifetime. CLV is a crucial metric since better product adoption can result in higher chances of users sticking to your app.
Improving CLV starts with identifying your most valued customer segments and running engagement campaigns to influence CLTV. Once you know each customer’s value, you can also particularly spend more to target high-value customers. You can further trigger segment-specific rich engagement campaigns to drive higher CLTV. All of these tactics help engage users on your app and drive more actions, resulting in higher product adoption.
5. Retention
The effectiveness of your product adoption drive can be instantly gauged by taking a look at the retention rate. A higher retention rate means that more customers are returning to your app. And this is only possible when they have entirely adopted the product. Most importantly, know that you cannot increase your retention rate overnight and avoid the trap of thinking of retention as a destination. It is instead a continuous journey that starts from day 0.
You need to constantly improve your product based on your customers’ feedback and keep bringing users back to your app to increase your retention rate. To optimize this metric, rely on actionable insights, thoroughly understand user behaviour, and deliver contextual app experience, which has now become seamless with no-code platforms. Also, remember that retargeting is almost as important as targeting right, so aim to retarget at scale using a range of channels and user journeys.
Related read: 10 strategies to improve mobile app user retention
Conclusion
The metrics mentioned above provide valuable insight into your app’s product adoption. These metrics cover a vast ground and highlight the areas you are thriving or lacking. Slicing and dicing the numbers associated with these metrics gives you clarity on the steps you need to take to improve it. Begin using these metrics as your guides to move the needle and meet your goals.
P.S Here’s a quick blog on the top ways to drive product adoption
However overwhelming the solutions may seem, our No-code Product Experience platform makes it easy. Learn more about how we can help you improve these metrics.
