


As a data-driven marketer, you don’t want to pointlessly spend precious marketing dollars on campaign after campaign, attempting to move the needle on your KPIs.
Right?
Key metrics such as open rates, CTRs, conversions, and uninstall rates equip you with valuable campaign performance intelligence.
But, they don’t give you a complete picture, do they?
You want need to gauge the actual impact of your marketing efforts in terms of your return on investment (and, move beyond mere vanity metrics!)
That need is only more amplified during these times of the current COVID-19 global pandemic.
Marketing budgets are getting stretched or slashed. User behaviour is continuing to evolve. And, consumer demand across most industries is falling or stagnating.
Set in this backdrop, we’ve launched a brand new feature – the Smartech Revenue Dashboard. This promises to help you gauge the exact revenue generated through your marketing campaigns across all digital channels. Even those not run on Smartech’s platform!
Getting Started
To setup your custom Revenue Dashboard all you need to do is follow a few simple and sequential steps:
- Click on “Insights” on the main menu
- Go to “Dashboards & Reports”
- Click on “Revenue”
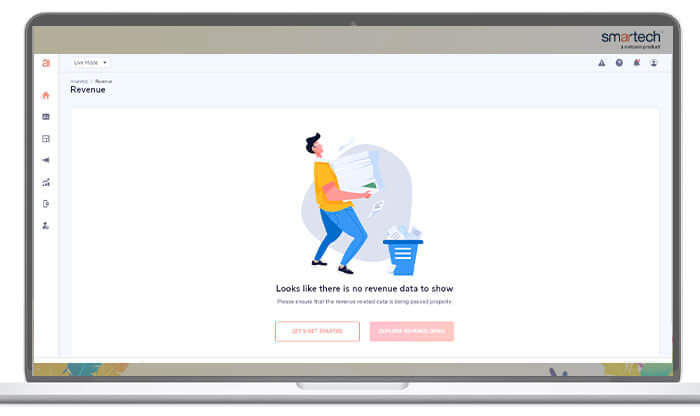
- Click on “Let’s Get Started”
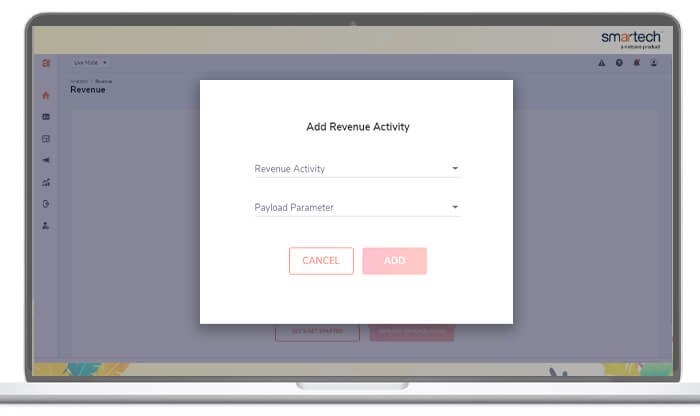
- Choose a relevant “Revenue Activity” and “Payload Parameter”
- Click on “Add”
In this context, here’s what the following mean:
- Revenue Activity: This refers to any conversion event – defined by you – that is being passed to Smartech. Eg. Product Purchase, Checkout, etc.
- Payload Parameter: This refers to the quantifiable parameter relevant to chosen revenue activity in the previous step. Eg. Amount, Price, etc.
Once you’ve completed these basic steps, you can now access your Revenue Dashboard, hassle-free!
Breaking it Down
On launching the Revenue Dashboard, you can gather deep-dive insights around your revenues through digital marketing efforts on two parent tabs:
- Overall Revenue:
Choosing this option gives you a top-level and granular view of revenues generated based on all the relevant data being passed to Smartech.
This includes conversions that happen across your website, mobile app, offline channels, etc., even those that aren’t directly attributed to campaigns built and executed on Smartech.
Trackable Metrics
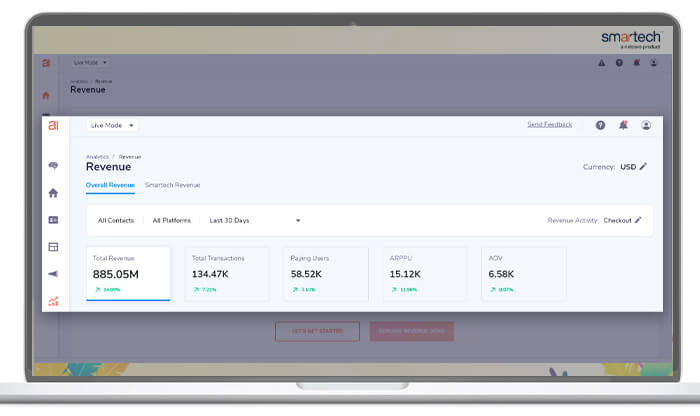
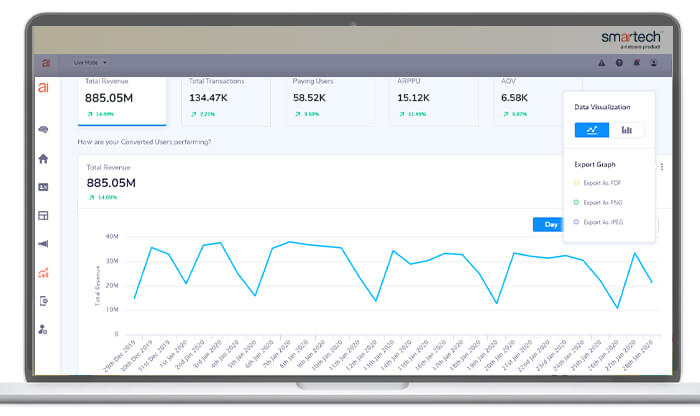
Under this option, you receive clarity on the following metrics, moving from left to right of the screen:
- Total Revenue: The cumulative revenue generated (by all your customers across platforms for a maximum of 3 months) based on the “Revenue Activity” and “Payload Parameters” selected previously
- Total Transactions: The cumulative number of completed transactions that result in the total revenue generated
- Paying Users: The total number of paying users responsible for the completed transactions and resulting total revenue
- Average Revenue Per Paying User (ARPPU): This represents the average revenue attributed to every paying user
- Average Order Value (AOV): This represents the average value of each completed transaction
Each of these metrics displays an accurate numerical value along with a percentage increase or decrease over the time period chosen.
That’s not all though!
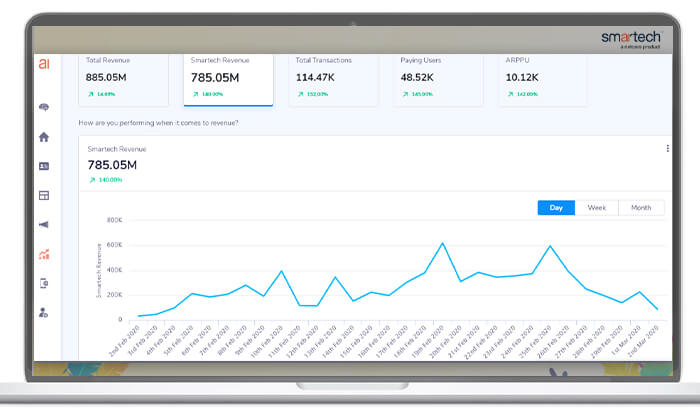
Data Visualization and Trend Analysis
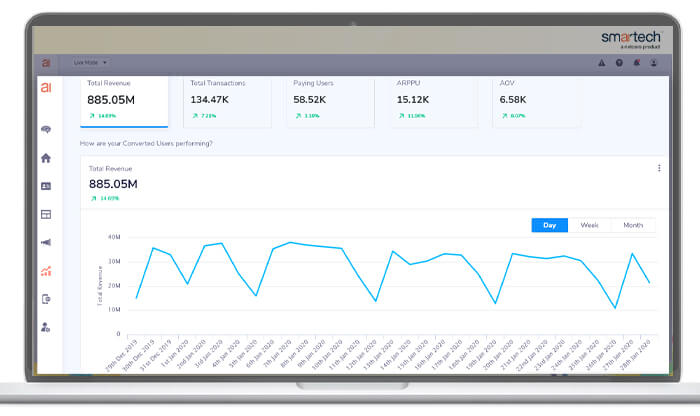
For each of these metrics, you can choose how you’d like to visualize the trend on a daily, weekly, or monthly basis. This is essentially a time-series graph to closely monitor falls or uplifts in the metrics you want to dive deep into.
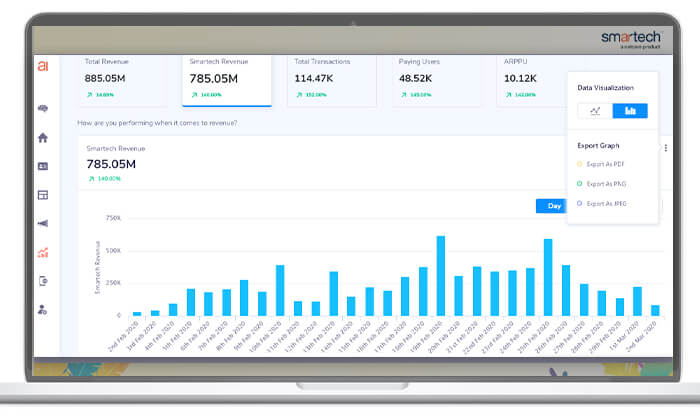
You may choose to stick to the default trend-line or opt for a bar graph to simplify visualization, depending on what fits your purpose and comfort.
Relative Trend Analysis
Always want to have a visual marker to make trend analysis more meaningful?
We’ve got you covered!
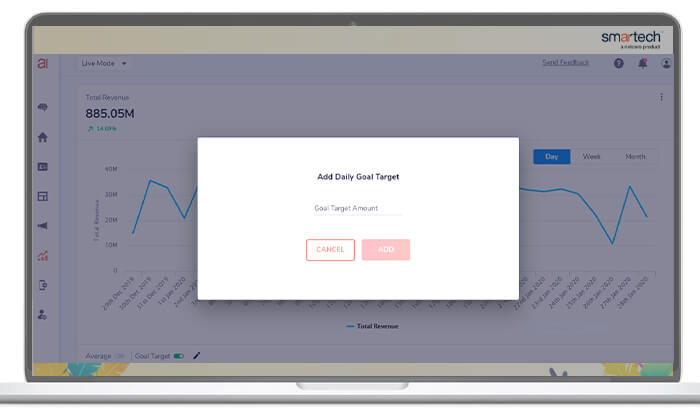
- Average Marker: Activate this toggle to reveal a marker that signifies the average for the metric in question that you’re carrying out trend analysis
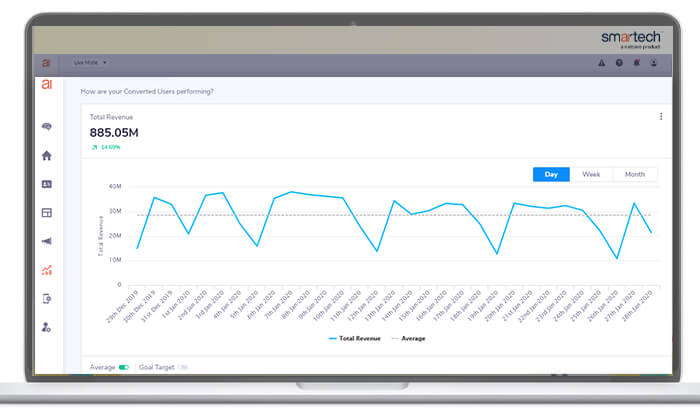
- Goal Target Marker: Activate this toggle to measure your progress (or drop) for the metric in question against your goal target. This can easily be set up when you enter your daily goal on enabling this toggle. We automatically extrapolate that to be reflected in the weekly and monthly trend visualization
Downloadable Reports
While the Revenue Dashboard makes visualization and analysis easy on the panel, these graphs can easily be exported as JPEG, PNG, or PDF files for future off-panel usage.
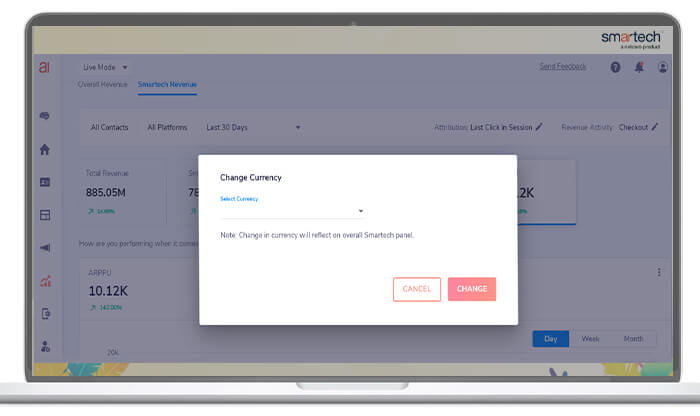
Currency Adjustment
You can analyze these revenue metrics in almost 30 global currencies, depending upon your region of operation and currency of function.
And, that brings us to the second and most important parent tab…
2. Smartech Revenue:
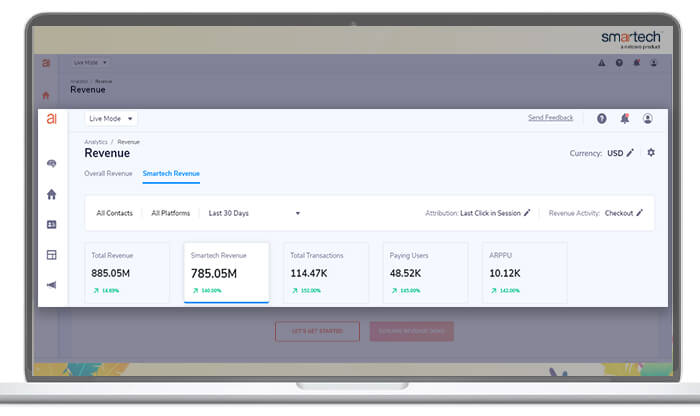
Choosing this option gives you an in-depth view of the total contribution to your revenue through all the multi-channel campaigns that you craft and deploy through Smartech.
Trackable Metrics
You can see 5 metrics, moving from left to right:
- Total Revenue: This figure is the same as what you would see under “Overall Revenue” and represents the cumulative revenue generated through all digital channels and platforms
- Smartech Revenue: The revenue attributed to all the multi-channel campaigns deployed through Smartech
- Total Transactions: The cumulative number of completed transactions that result in the total revenue generated through Smartech
- Paying Users: The total number of paying users responsible for the completed transactions and resulting total revenue generated through Smartech
- Average Revenue Per Paying User (ARPPU): This represents the average revenue attributed to every paying user through campaigns run on Smartech
Each of these metrics displays an accurate numerical value along with a percentage increase or decrease over the time period chosen. Just as was the representation under the “Overall Revenue” parent tab.
Data Visualization and Trend Analysis
The data visualization options that applied to the “Overall Revenue” parent tab, apply to the “Smartech Revenue” tab as well. This makes the dashboard user-friendly and intuitive at the same time; significantly reducing the time you require to effectively leverage this new feature.
Relative Trend Analysis
This too can be recreated for the contribution of Smartech to your overall revenue – as was the case under “Overall Revenue”.
By enabling a visual marker around the average and your goal target, each of these above mentioned metrics can be more effectively analysed, basis the trends that emerge.
Downloadable Reports
Go one step further and easily export these trend graphs as JPEG, PNG, or PDF files; depending on what works best for you.
Currency Adjustment
You can analyze these revenue metrics in almost 30 different global currencies, depending upon your region of operation and currency of function.
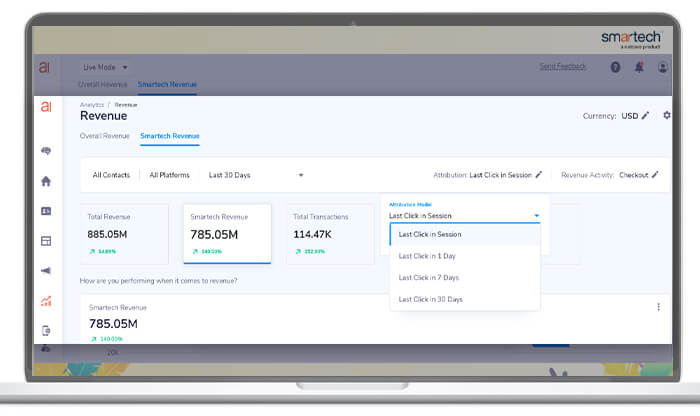
Attribution Model
This unique feature allows you to measure both the conversions and the digital touchpoints leading up to this conversion. This is based on last-click attribution which implies that the last digital touchpoint will receive 100% credit for conversion.
This attribution can be analysed over specific time-based windows: 30 minutes, 1 day, 7 days, 15 days, and 30 days – giving you the flexibility to gain deeper insights over a period of time.
For example; when the attribution window is 1 day and there are users who click on an app push notification at 11:00 AM on April 8 while completing the purchase of any product before 11:00 AM on April 9th, it will be attributed to the app push notification campaign.
Channel-Wise Revenue Contribution
So, you’ve analysed the contribution of your marketing automation efforts through Smartech.
But, you soon go: “Hmm. I could do with more insights!”
That’s precisely what you get with channel-wise revenue contribution through Smartech!
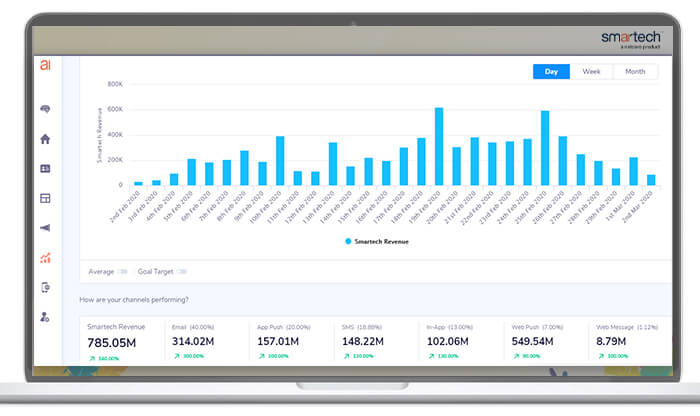
Now easily see the amount of revenue each channel is contributing through Smartech. Also, gain visibility on the percentage increase or decrease in this contribution over the time period chosen.
Advantages of the Smartech Revenue Dashboard
- Easily analyse trends: Keep a close watch on the revenue metrics that matter the most at a single glance. Go granular by analysing trends with accurate figures and data visualization enablers quarter on quarter
- Benchmark performance: By laying down average or goal target markers – visually – you can measure the movement of respective revenue metrics relative to these
- Measure marketing efficiency: Now equip yourself with real-time insights that allow you to tally every marketing dollar spent to marketing dollar earned!
- Optimize channel spends: A bird’s eye view of channel-wise revenue contribution through Smartech will help you identify what’s working and what’s not. If email as a channel is producing diminishing returns and app push notifications show an upward contribution trend, you know what you need to do!
- Take agile marketing decisions, faster: With relevant data and actionable insights at your disposal, you can tie it back to your overall digital or mobile marketing strategy, re-evaluate campaign objectives, and reconsider your user segmentation strategy
Keen to reduce your dependency on vanity metrics and instead focus on actionable metrics that matter the most? The Smartech Revenue Dashboard is your antidote! To learn more, schedule a demo with us, today.
