


Empowering data-driven marketers to consistently deliver differentiated customer experiences at scale across all channels; has always been our core mantra.
Having said that, at Netcore Smartech, we believe one of the most powerful channels is your mobile app. Our experts have spent a lot of time thinking and developing a real-time app churn management solution that will help you retain your users.
And, the reason is quite simple: it is impossible to ignore this if you want to build a sustainable business.
Why?
Look at the below customer acquisition graph:
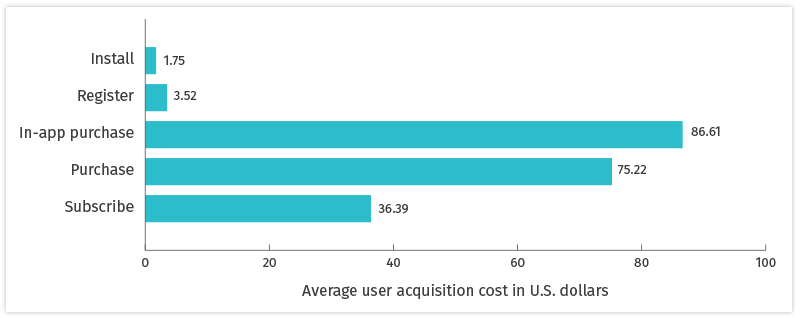
Clearly, the cost of extracting money from your customers is high!
But, how would you like to grow your business without adding another dime to your marketing budget?
Bain & Company research says that simply increasing your user retention rates by a mere 5% could increase your profits by 25% to 95%.
To retain your users, you need to see how many users stop using your app, where they drop off, and why – in order to fix the leak in the bucket.
So how do you analyze your app uninstall on a daily, weekly, or a monthly basis?
Have you heard answers like these:
- Monitor your uninstall numbers regularly
- Look for user drop-off points
- Compare data-points to analyze
- Identify the cause for churn…and more
In reality, we understand how challenging and time-consuming this could be. The tsunami of data-points and above all analyzing your app uninstalls is challenging because it is based on unpredictable human behavior.
So, what is the solution?
Enter Raman!

OUR intelligent, analytical, and data-driven AI engine. YOUR go-to data analytics guru and marketing best friend!
With Raman by your side, the journey of understanding your users’ behavior and using that insight to prevent uninstalls or churn will be a smooth one.
First things first, Raman crunched your app user data and classifies your current users into 5 buckets:
- Day 0 (same day post download) uninstallation
- Day 7 uninstallation
- Day 15 uninstallation
- Day 15+ uninstallation
- Retained users
Classifying your user data based on their uninstallation activity period will add context to the otherwise vast user data. With these relevant segments in place, it will become easier to identify the underlying patterns.
But just a cohort analysis …..really??
Look at the below month-wise cohort graph:
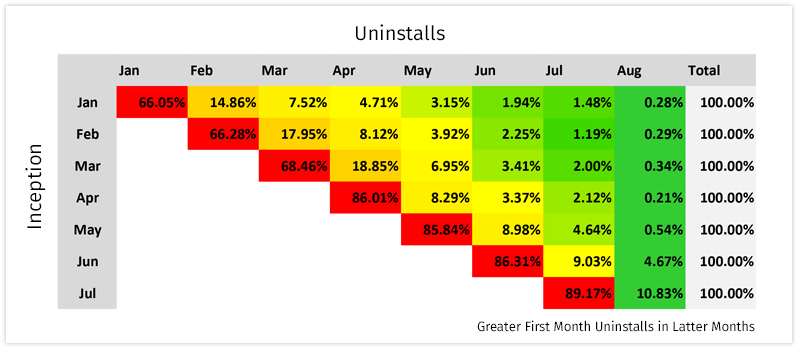
A simple month-wise cohort will help you identify patterns like the above: greater first month uninstalls in latter months, etc.
A few important questions like “How the heck do I use this information?”, “What do I do with this fact?”, etc. remain unanswered.
Fortunately, our data-driven AI engine Raman can help you break down this data further. So, you’re not stuck in the black hole of data analytics.
Once Raman has classified your users into 5 buckets, he will help you uncover in-depth user behavioral patterns and actionable insights.
Let us take a quick sneak-peak into Raman’s retention intelligence,
- Sequence of Events
Each user engages with your app differently. The more you understand the path or sequence of events that your users go through towards conversion – the greater the awareness of their experience, the pain points they face while using your app, and what is leading to dissatisfaction.
Raman helps you trace the path or the sequence of events performed by the users on your app, in each of the 5 buckets mentioned above.
Look at the below graph of the path taken by the users belonging to the ‘Day 0 uninstallation’ bucket :
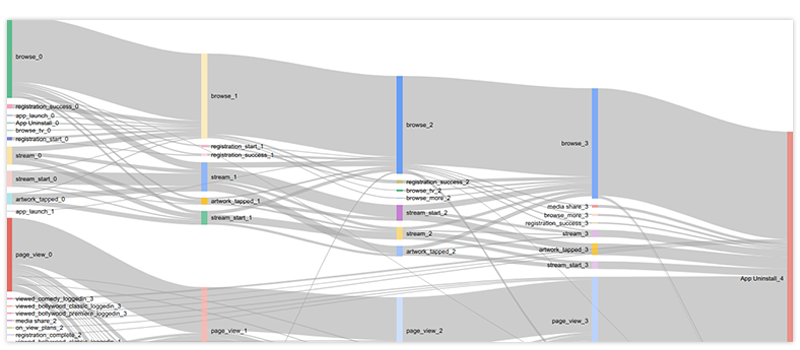
With this detailed ‘Sequence of Events,’ graph you can understand that two activities are performed commonly i.e. ‘browse’ and ‘pageview’ by your users belonging to the ‘Day 0 uninstallation’ bucket.
With each activity, Raman gives you a detailed path analysis of your users.
For instance:
Users who registered on your app and then started browsing content – uninstalled your app on the same day. This insight from Raman helps you understand that your users are unable to easily browse and find engaging content, which is urging them to uninstall.
A smart marketer, like you, would then need to adopt contextual app walkthroughs or deploy personalized content recommendations to address this challenge. But, which content to recommend?
Raman helps you answer this question as well!
- Differentiating Events
Raman identifies the differentiating events performed by your ‘Retained users’ vs. your ‘Day 0 uninstall’ users.
For instance:
In the case of an OTT app Raman would help you identify differentiating events performed by the two segments; see the below sample events:
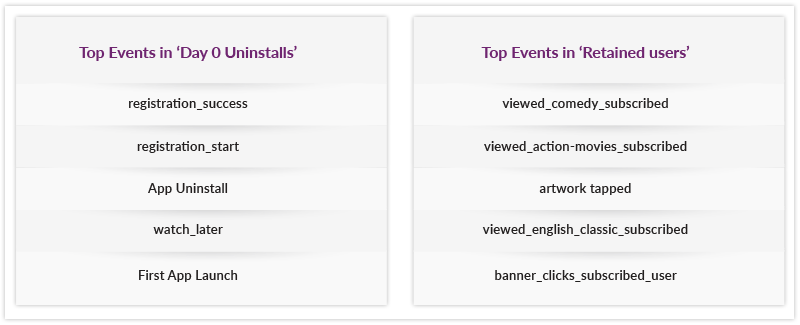
With this insight, you can easily identify that users who have performed the differentiating activity i.e viewed comedy and action movies stick around more. You can act on this insight by sending comedy or action movie content recommendations to your users in order to increase app stickiness.
See, how Raman helps you cover all bases?
But he doesn’t believe in just basic guidance, he is a hardcore data guru and takes it one step higher.
- Segmentation
Along with understanding your user behavior on your app, it is important to classify all your users into segments to unearth their probable behavior in alignment with your business goals.
Based on the users’ intent to perform a conversion activity like purchase, subscribe, etc. and the differentiating event performed by them like ‘add to wish list, ‘add to cart’, etc; Raman segments your user and gives you actionable insights into their most probable behavior with respect to your KPIs.
For instance:
Have a look at the below table, Raman has segmented your users into ‘Loyalist’, ‘Early Enthusiast’, ‘Engagers’ and ‘Window Shoppers’. He further gives each segment’s count and uninstalls.
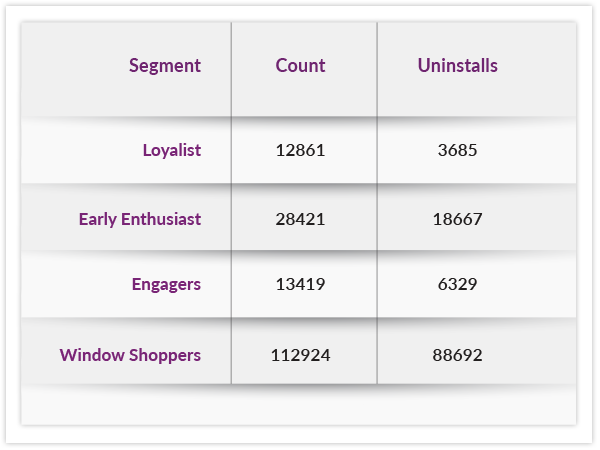
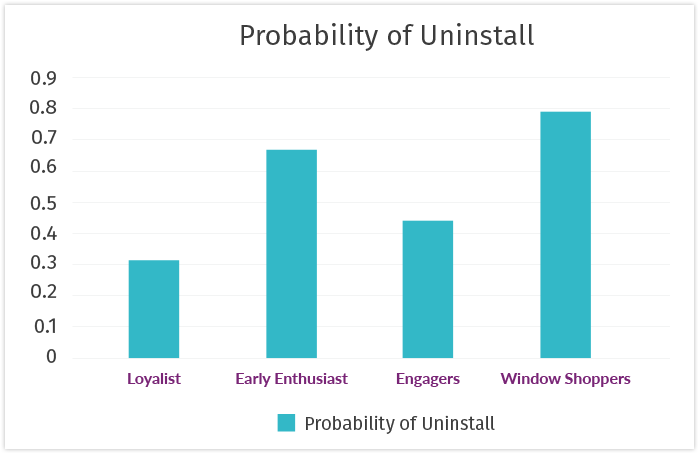
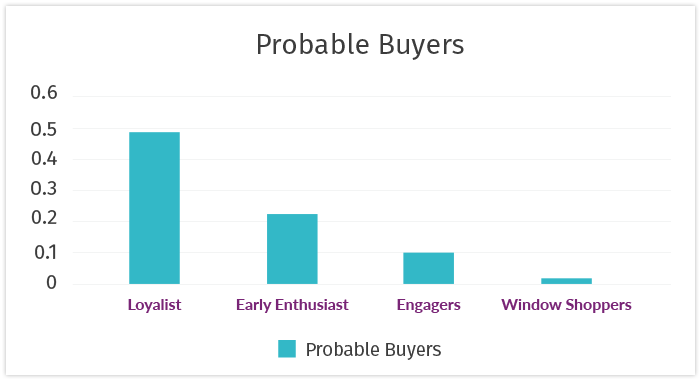
Let us say your KPI is to identify probable buyers and users who will probably uninstall. Raman will help you identify them, like this:
By segmenting users, mobile marketers can make the most of their campaign budgets by targeting the right users.
You can now speak directly to those who are most likely to convert, without wasting money on impressions or users who aren’t ready to even engage.
And, you can personalize marketing campaigns to more effectively nurture prospects down the funnel and provide a memorable experience that keeps users coming back for more!
Prevent CAC from outstripping your CLTV!
Current users are priceless sources of information.
Reducing your CAC, increasing your CLTV, and increasing user retention should be your ultimate goal. But, you can’t stop there if you want to keep your hard-won users in the long run.
Technology changes, your users’ habits, behaviors, needs, and expectations change. While you are focusing on improving your app, fixing bugs, and creating kickass apps to solve your users’ problems, Raman has got your back, he will ensure your app becomes a staple in their lives.
