


You’ve seen marketing funnels before. They tell you where users drop off. But not why. They show you charts. Not insights.
Funnels should be strategic tools. They should help you fix what’s broken. And double down on what’s working. In today’s high-volume customer engagement world, it’s not about how many campaigns you run but how efficiently you convert to drive revenue growth. That’s why we’ve reimagined Netcore Funnels with best-in-class capabilities that help you visualize, deep-dive, and act on what matters.
Funnels today
First let’s understand what funnels used to look like and even do today in many MarTech tools.
Before we dive into what’s new, let’s look at what most marketing funnels still look like today.
In many MarTech tools, funnels are static charts. They show you basic metrics like drop-offs and completions—often just for unique users. But they stop there.
- No way to see retries or total effort for conversions
- No in-depth breakdown by who is converting or what they’re buying
- No insights on how much audience is reachable
- No option to act on insights, fast
They’re disconnected from campaign planning, personalization, and business outcomes. In short—they’re reports, not tools.
That’s the gap we set out to fix.
Funnels reimagined with Netcore
Funnels that capture every conversion attempt, not just one user per session
Unique conversions show net impact—but they miss the full story. With Total Conversions, you see every time a user tries again. This helps you measure true effort per conversion—like how many emails or views it takes for a purchase.
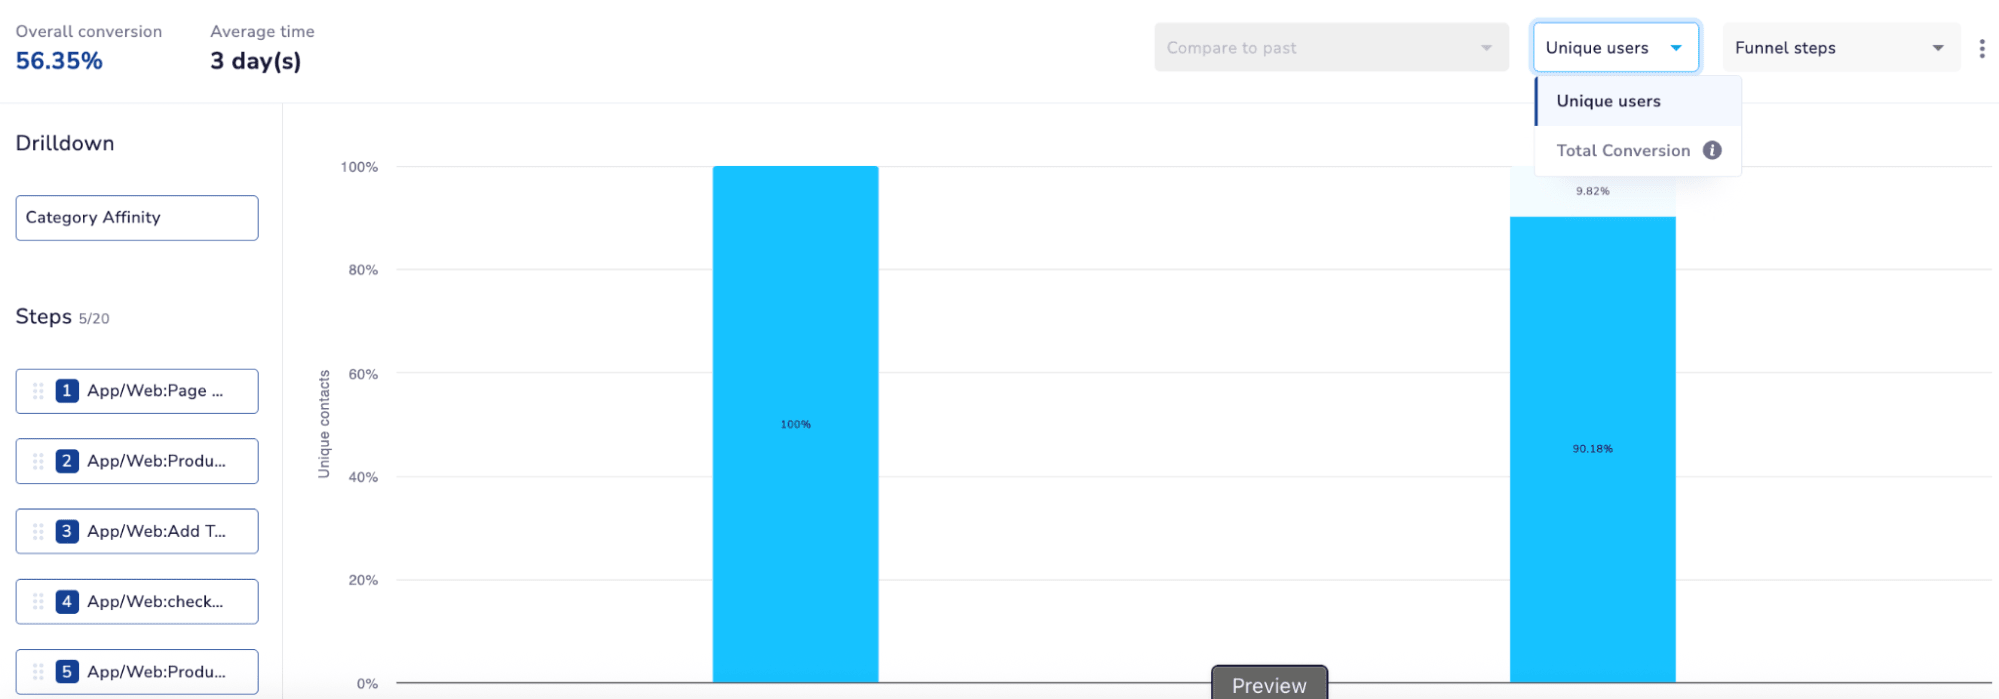
This helps marketers like you plan backwards and improve your campaigns every quarter, month, or even every week.
Funnels that help you budget better
With the Funnel Efficiency Ratio, you get instant clarity on how many actions (emails, clicks, messages) lead to a single conversion in the next step.
For example:
10:1 = 10 emails need to be sent for 1 email open
Use it to:
- Evaluate communication cost per conversion
- Track efficiency shifts over time
- Benchmark campaign impact
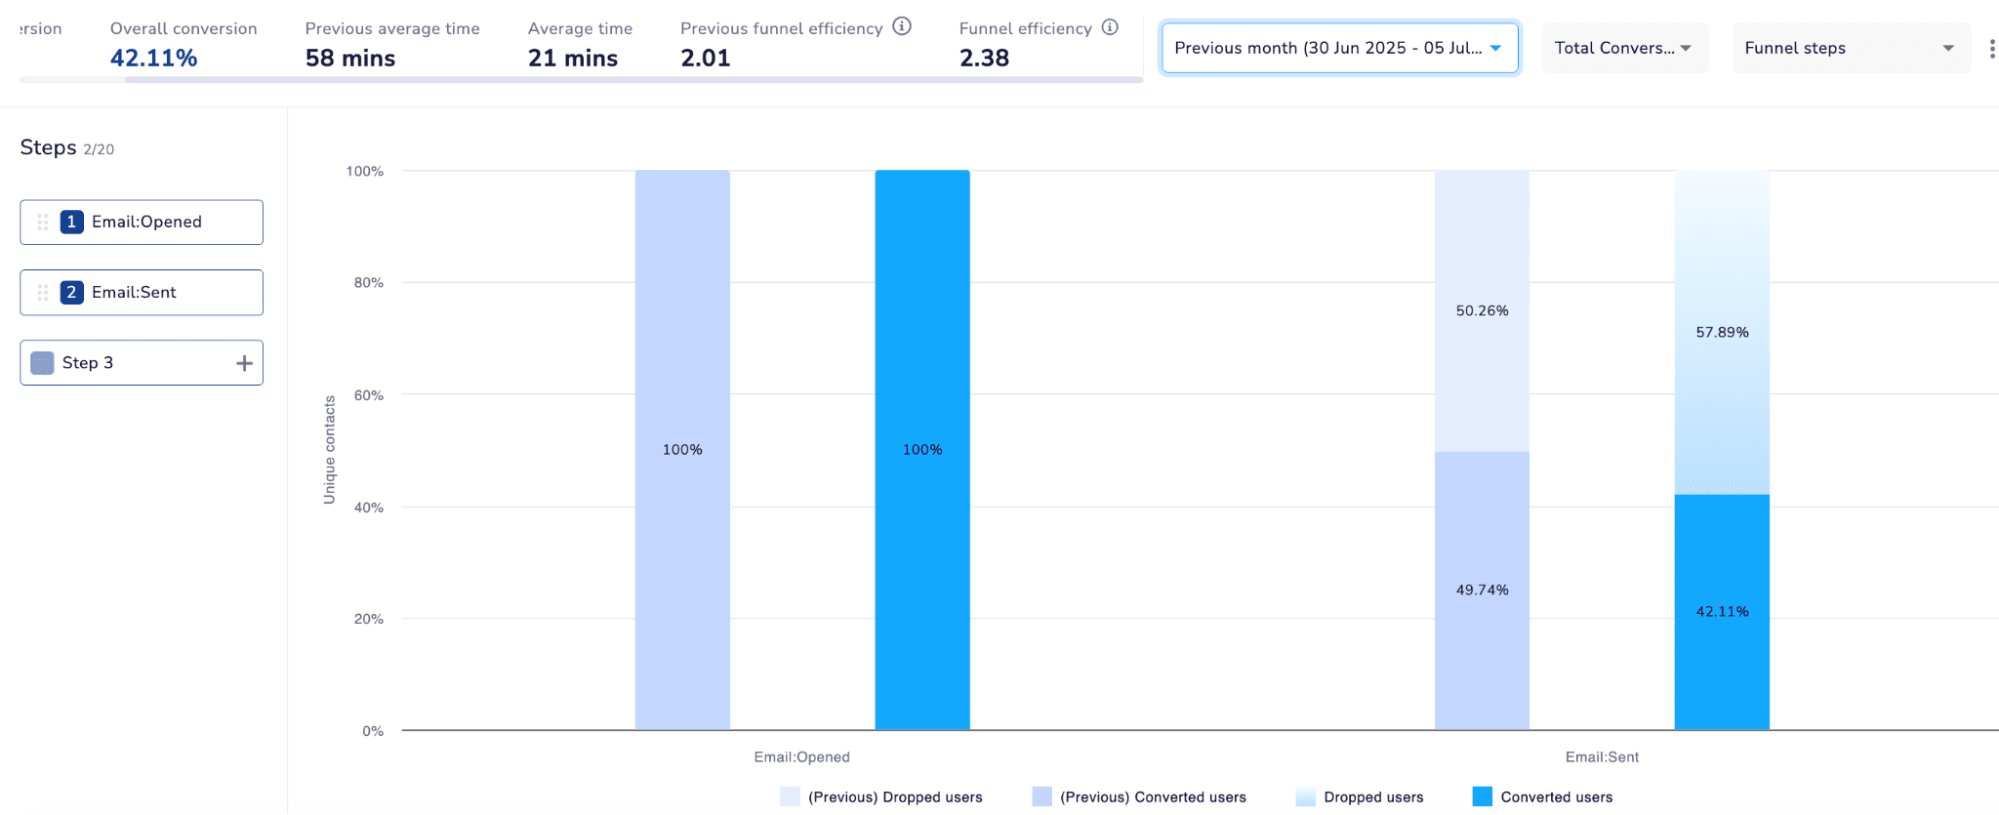
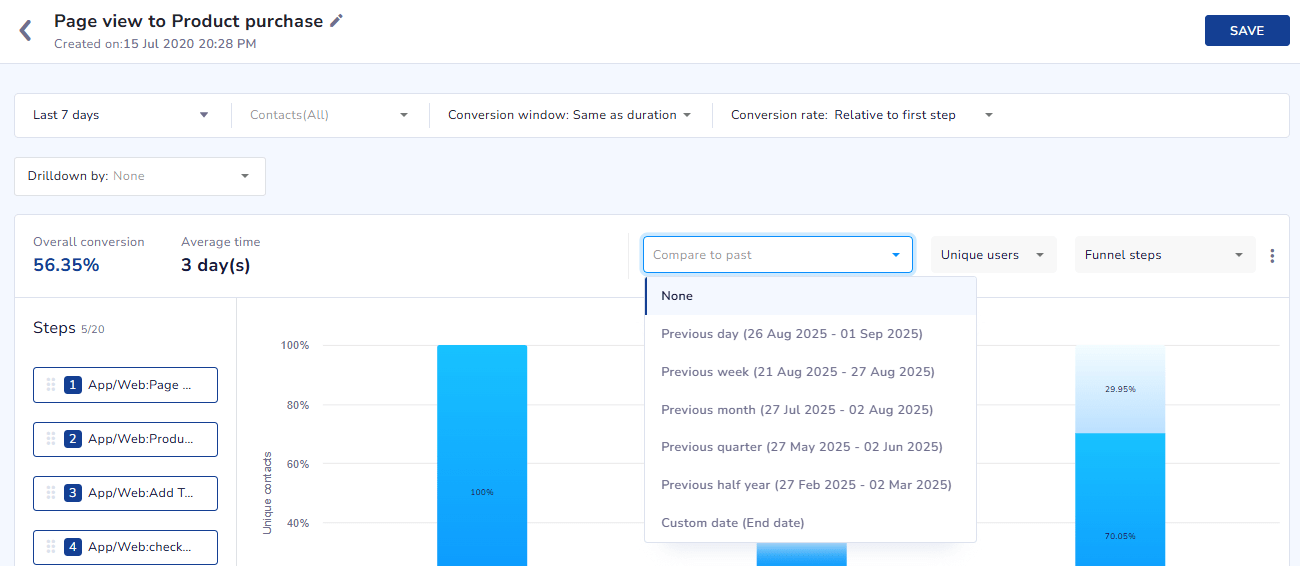
Funnels that help you compare performance over time
Learn from your past campaigns and use those insights to improve your current ones. Compare funnels across past days, weeks, months, or custom date ranges.
With Conversion Trends, spot seasonal dips, track campaign fatigue, and validate new creative performance. Visualize trends by region, segment, or product line—and take action fast.
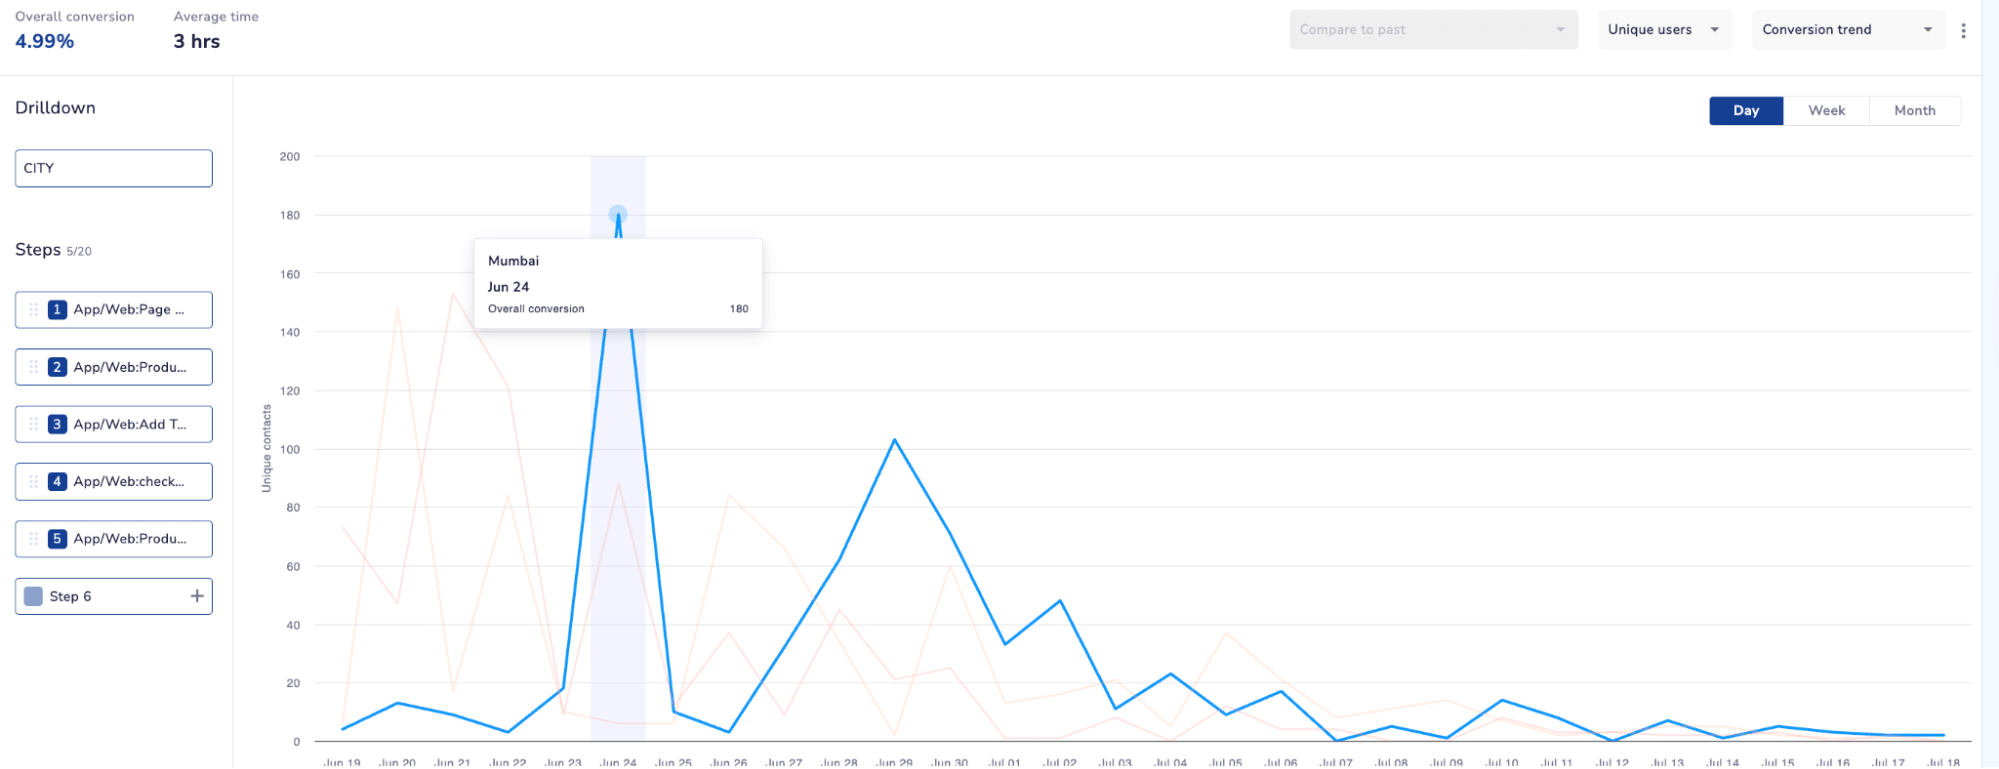
Overall, these comparisons and trends help you understand campaign performance over time and help choose where to optimize.
Funnels that show you what works for each segment, not just totals
Overviews are good for a broad view, but when it comes to improving campaigns, it’s about identifying micro performance data and optimizing it. Which brings us to “Drilldowns” where you isolate parameters and deep dive into specific performance signals.
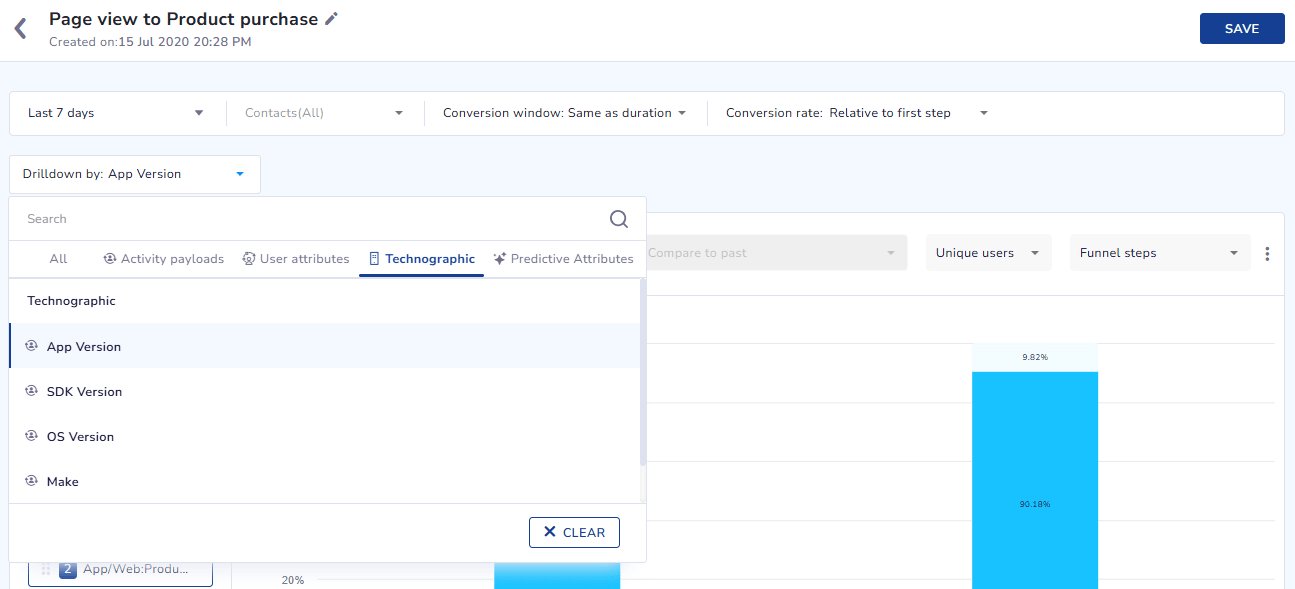
More than numbers, insights on what to sell with affinities
Drilldowns give insights into specific performance parameters. But we’re taking it a step further with Affinities in drilldowns. Netcore’s Affinity-based segments is a special AI capability that turns 20+ dropdowns into 1 smart segment and predicts what customers like.
And now this is in funnels.
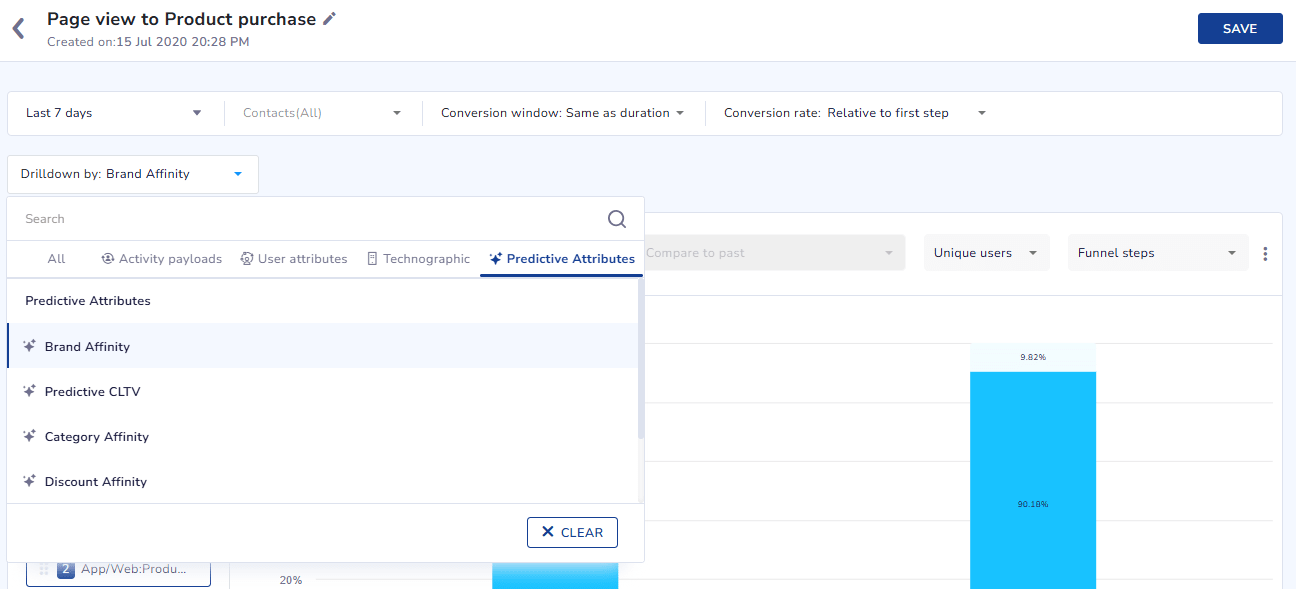
Which means along with current performance signals, marketers can now open analytics, choose affinities and get insights on what to sell next!
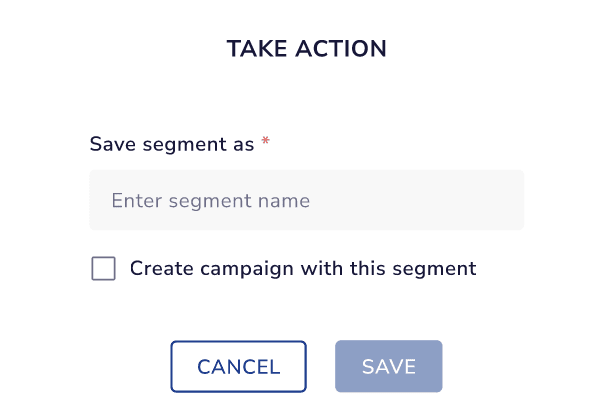
Turn funnel insights into campaigns
Turn insights into action—without leaving the Funnels workflow.
- Save any funnel as a segment to target users based on their steps they took.
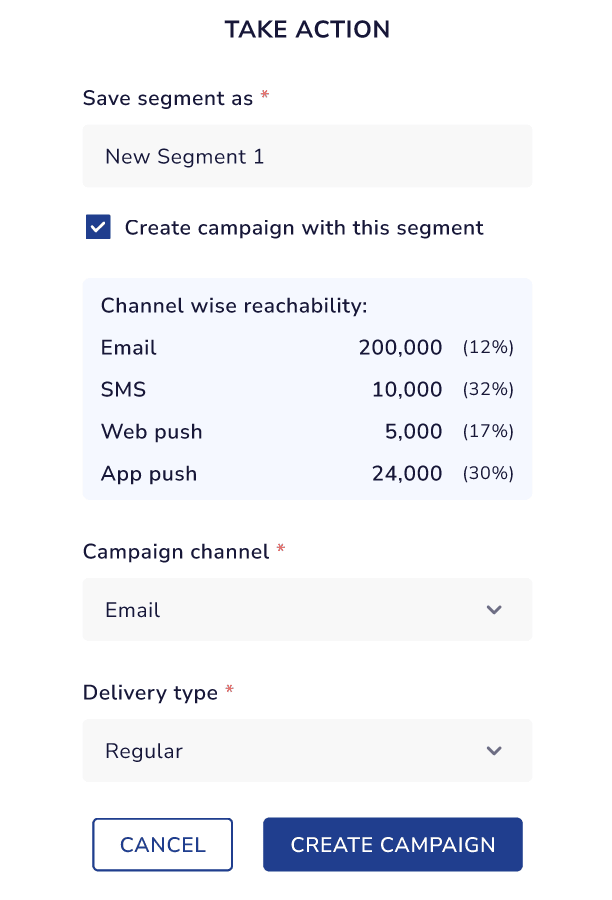
- Instantly launch a campaign on that segment without switching between tabs.
- See channel-wise reachability (email, SMS, WhatsApp, push) before sending, so you can choose the most effective channel.
It’s not just about knowing what to fix—it’s about acting on it, fast.
What’s better about funnels with Netcore?
So how do Netcore Funnels stack up against the typical ones you’ve seen before? Here’s what sets them apart—and why marketers are calling them their new favorite decision-making tool.
| Typical Funnel | Netcore Funnels |
| Tracks unique users | Tracks total conversions and retries |
| Generic drilldowns | Drilldown by AI segments like affinity, predicted customer lifetime value |
| One-time snapshots | Compare across days, weeks, months |
| Read-only | Built to feed insights into action (like campaigns, nudges) |
| No reachability | Get channel-wise reachability directly from the funnels |
| Partial actionability | Not just save and download segments, run campaigns directly from Funnels |
Customer success with Netcore Funnels
Now let’s see how brands are using Netcore Funnels to driver better business decisions.
How a leading bank optimized loan onboarding with funnels
A leading private bank used Netcore Funnels to analyze their onboarding-to-loan journey, identifying where users were dropping off—and how long each stage was taking.
They tracked the full funnel from first app install → registration → KYC → loan application, using Netcore’s Total Conversions and Average Conversion Time metrics. Initially, it took users 45–50 minutes on average to complete onboarding. Over three months, the team optimized communications powered with insights from funnels, bringing the average down to 30–35 minutes. Now they’re looking to reduce it under 15 minutes.
How an apparel brand cut WhatsApp messages per Purchase by 47%
A leading fashion retailer used Netcore Funnels to understand how many WhatsApp messages were needed to drive purchases. By enabling Total Conversions, Compare to Past, and Funnel Efficiency Ratio, they could track performance across quarters and improve messaging efficiency.
In Q4 FY24–25, the brand needed to send an average of 7.5 WhatsApp messages for every completed purchase (7.5:1 ratio). After optimizing campaigns using Funnel insights in AMJ 2025, they brought this number down to just 4 messages per purchase (4:1)—a 47% improvement.
The takeaway? Funnels helped them cut costs while increasing conversions, by focusing on what messages mattered, and when.
How a fashion brand boosted repeat purchases with Affinity Drilldowns
A popular fashion brand with over 100 product categories wanted to go deeper than just “best-selling items.” Using Netcore’s Affinity Drilldowns, they analyzed the funnel from
Product views → add to cart → purchase,
segmented by category preferences.
They discovered that their highest-converting categories weren’t just “jeans,” but a combination of jeans, shirts, and polo t-shirts. They saved these segments and launched targeted communications for users showing interest in those three categories.
Next, they used Cohorts to track repeat purchases for each segment—and found that users interested in these three categories had a 25% higher repeat purchase rate than the overall user base.
The use cases: What can you do with Netcore Funnels
Ecommerce: Identify how many emails/WhatsApp sent/product views/ add to carts it takes before a purchase. Let’s say it’s 10:1. Compared to the previous month, it was 11:1, and the previous quarter, it was 15:1. This means there’s progress.
FinTech: If your campaign conversions are better this quarter compared to the previous, understand what’s working better to replicate for future campaigns.
Pricing strategy: In Funnels, marketers can drill down by product price to see which price ranges users are adding to cart—enabling them to create buckets like low-, mid-, and high-priced items based on actual user behavior.
Try the new funnels
Funnels with Netcore are no longer just about charts. It’s your conversion control room.
If you haven’t explored Netcore Funnels recently, it’s time. This is no longer a dashboard feature—it’s a strategic decision-making engine. Contact your CSM to get started.
If you’re new, see funnels in action, get a demo.


