


“Data is becoming the new raw material of business”- Craig Mundie
It’s super essential to evaluate data to strengthen your email marketing strategy and campaign performance so that at the end of the day your email metrics reflect the growth, engagement and returns.
Keeping your necessity in mind, Netcore Email brings to you a smarter and more Advanced Email Analytics to make life easier for you.
Now get complete clarity on your campaign performance and connect hidden patterns to form an impactful customer engagement program!
What changed in Insights?
- Detailed email funnel performance data
- Email distribution analysis drilled down according to time and mailbox provider.
- User engagement tracking and management.
- Custom reports scheduling with multiple data points from across the dashboard
How “Insights” makes data analysis easier for you?
The right metrics help you make accurate estimates and predictions. With the new insights dashboard, don’t be limited to analyzing opens and clicks. Now you can now dive deeper into distribution over time, mailbox providers, time slot analysis, frequency monitoring, funnel performance, and much more.
No more switching platforms for separate campaign analysis. You can perform complete analysis of your email program on a single page with the Insights dashboard.
What’s new on the Insights dashboard?
Let’s take a look at the newest features that will help you get more useful and relevant data about your email campaigns.
Email Distribution Analysis Widget
The Email Distribution Analysis (EDA) widget displays an overview of the distribution of emails. It shows email requests, deliveries, opens and clicks broken down by the day. To view the breakdown by the hour of the day, click on a single day from the chart.
You can also split the data by mailbox providers. The EDA module gives you a bird’s eye view of your overall email performance across all campaigns.

For example – If a specific time slot gets higher engagement for Gmail users, you can plan future campaigns around that particular time slot to get better engagement.
Engagement Analysis Module
Next up, you have the engagement analysis module. With this, you can now efficiently understand your user engagement with your emails. You can easily get answers to questions like-
- How often do your users engage with your emails?
- What percentage of your user base counts under loyal subscribers?
- How many users are on the brink of churning out?
- What’s the time that your users take to engage with your emails?
What’s exciting is that there are two parts to the Engagement Analysis module – The Engagement Recency-Frequency module and the Time-to-Engagement module. Let’s understand them further in detail.
1. Engagement Recency-Frequency (ERF)
ERF provides an overview of your email list in an intuitive 3×3 matrix. At a glance, you can identify users interested in your emails as well as those on the verge of unsubscribing to them.

This matrix saves you the hassle of having to manually check email campaign metrics and analyzing the overall list behavior. This gives you an automated segmented list for which you can exclusively craft your emails for!
For example: It reduces the likelihood of email churn by displaying signs of dropouts based on the engagement recency. With this data at your disposal, all you need to do is initiate a win-back campaign against users that are on the verge of dropping out. Simple!
Alternatively, you can develop a strong sunset policy to clean up unengaged users from your list, quickly and effectively.
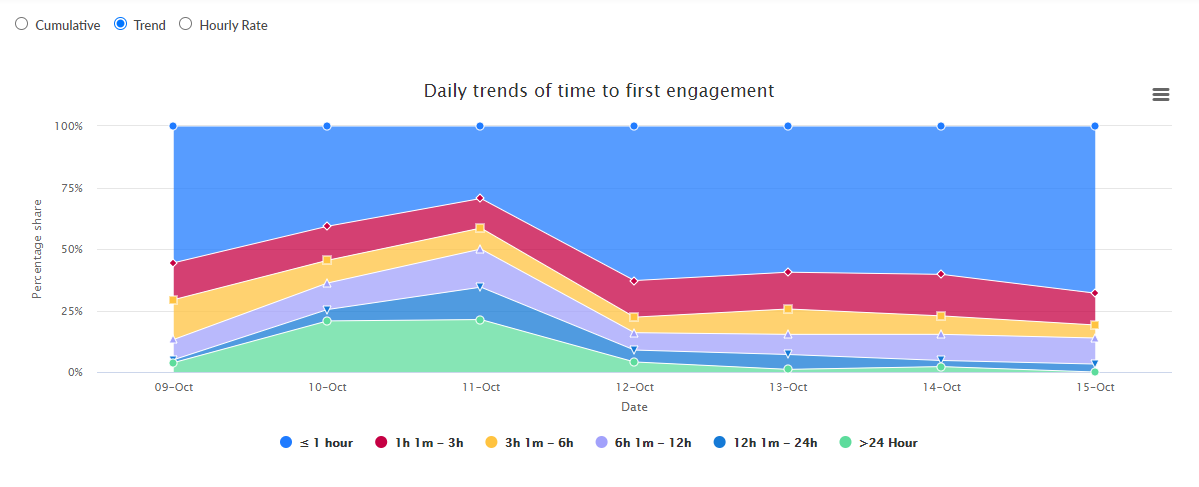
2. Time-to-Engagement Module
While most companies see the highest engagement within the first hour of sending an email, some of your readers may enjoy saving your emails for reading later.
The Time to Engagement module clarifies this for you in a visual manner. Take a look at the graphs below for a better understanding of what to expect.

Engagement module is available on demand for enterprise customers
Deliverability Dashboard
Did your emails reach the inbox?
To save you the time visiting Google Postmaster and analyzing the metrics on their platform, we bring all the data in a single dashboard.
The deliverability module displays a time series chart of deliverability errors, domain reputation trends, authentication records, spam reports over time, and more.

The Inbox Placement Rate module offers a projected estimate of the percentage of emails that got delivered to the inbox.
Inbox data is split up for different mailbox providers including Gmail, Yahoo/AOL, Outlook, etc.
Have a look at the dashboard image below to know exactly how the data shows up:

The average campaign deliverability is plotted over a bar graph as well as a pie chart to give you an overview of the past email campaigns at a quick glance.
Deliverability module is available on request for enterprise customers
Funnel Analysis Module
Analysing how your emails performed from the moment they are sent to the engagement they received tells alot about your email strategy.
The funnel analysis module is designed to give you an overview of your email funnel performance in terms of the deliverability, the opens, the clicks, and other related metrics in a simple 3×3 grid similar to the one in the ERF module as shown above.
The funnel analysis module allows us to filter the results by the following details:
- Sending Domain
- Recipient Domain
- Tags
- Time frames

With this module, you can take a peek into which of your users have a higher engagement, which one of your sending domains sends better emails out and gauge the performance across various time frames.
Funnel Analysis is available on demand for enterprise customers
Custom Reports for Organizational Reporting
Most of the reporting is repetitive with a few parameters changed (for example, the dates, campaign tags etc). With custom reporting, you can save your reports for the future and get updated data every time to refresh the reports.
When you are in the reporting module, set up the filters that you need to view, and click the “Save | Schedule” button as shown in the screenshot below:

Enter the name and add an optional description for the report in the popup.
The next time you wish to view the reports, visit Analytics->Custom Reports where all your saved reports are available for viewing. If you do not want to generate a report every time, you can schedule and send these reports directly to your email address.
Custom reports are available on demand for enterprise customers
Latency Monitoring
Transactional emails are time-sensitive. Think of OTPs and payment processing related emails. Your customers will be upset with delays in receiving these emails and you know that, it’s absolutely not good for your brand’s reputation as well as the sales.Hence, latency monitoring comes to the rescue!
With latency monitoring enabled, you can view how long your emails take to get delivered
The reports are split up into multiple time slots and show how long the majority of your emails take to get delivered.
The report can be generated once a day where the data from the entire day is collated into the following time slots:
- 0 to 5 seconds
- 6 to 10 seconds
- 11 to 20 seconds
- 21 to 35 seconds
- 35 to 60+ seconds

The time is calculated from when the server receives the email request to the time it hits the mailbox provider servers. You may request your account manager or get in touch with the support team to enable latency monitoring and get the report generated for your wonderful emails.
Latency monitoring and latency reports are currently available on request and only for enterprise customers that send out transactional emails.
If you are an existing enterprise client, you can request the advanced email analytics right over here-> Netcore Advanced Email Insights. And if you aren’t subscribed to our platform or are on an individual plan, then click on the top right button to schedule a demo with us!
#fortheloveofemails
