


eCommerce marketers were faced with mounting challenges over the last year, changing how they marketed their businesses.
Changing behaviors presented a great opportunity for eCommerce stores
One common theme across industries was the increase in the number of marketing emails that were sent out.
As an email service provider, we were able to take a bird’s eye view and analyze over 100+ billion emails to put together our Email Benchmark Report for 2023. These email marketing statistics share insights into how email marketing has changed over the years.
The report details unique strategies using Artificial Intelligence to enhance long-term email marketing performance, deliverability, and engagement.
Breaking down the email marketing statistics of the eCommerce industry.
72% of email subscribers use Gmail
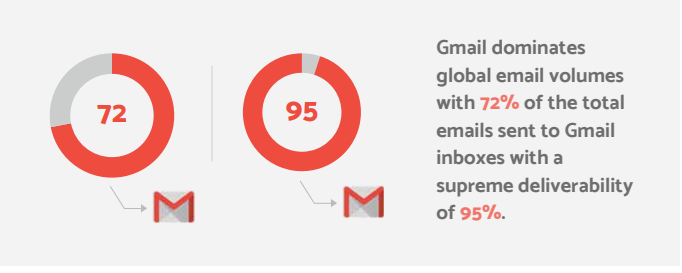
It’s common knowledge that most of the subscribers in email lists are on Gmail. Widespread adoption is due to integration in Android devices and ubiquitous Google sign-up and sign-in options on websites.
Gmail is also the most advanced inbox provider that knows how to tackle spam and improve user experience.
With superior email analysis, it achieves the highest email deliverability rate of 95% across major mailbox providers.
Email Marketing Statistics for the eCommerce Industry
The eCommerce industry comes with high email volume considering the number of offers and product inventory changes they send to users. Let’s take a look at their email metrics here.
96% average inboxing rate across all mailboxes
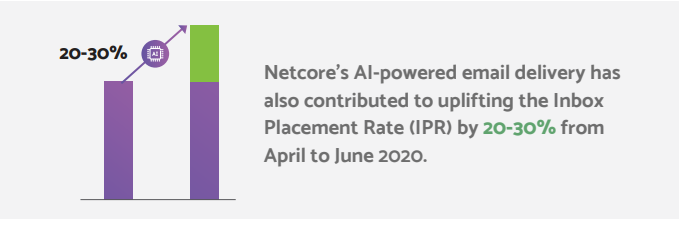
With the sheer volume of emails sent out, the eCommerce industry continues to maintain a high 96% average inbox placement. The lockdown affected deliverability since the email frequency had dropped, it has since improved a lot.
Pairing with Raman, our AI engine, results in a 20-30% increase in inboxing rates across all industries for better deliverability.
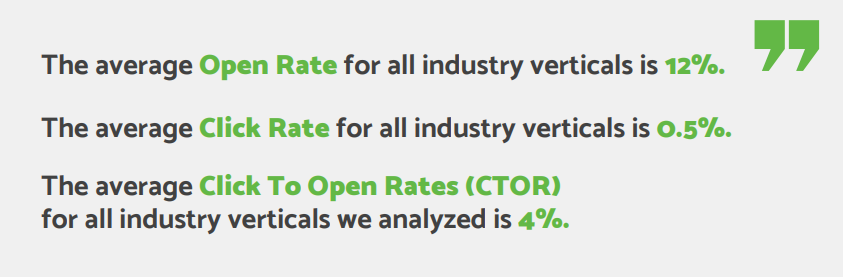
Open rates averaged at 10.67% with a 0.31% click-through rate

If your eCommerce campaign gets higher than an 11% open rate, your campaigns are performing above average. The average click-to-open ratio for eCommerce brands is 2.89%, as displayed in the graph above.
You can improve your marketing campaign performance even further by optimizing your subject lines designed to pique users’ curiosities and improve opens:
- Find better-performing subject lines with A/B tests
- Add emojis to make your emails stand out
- Personalize the subject line with user names, or product names
- Add specific numbers instead of rounding them off
With the help of AI-powered tools, like our Subject Line Optimizer, you’re able to benefit from the insights and analysis that come from billions of subject lines and their performance metrics.
With the insights generated from the tool, you can get suggestions to modify your subject line to increase the probability of your users engaging with them.
The average bounce rate is 0.43%
Compared to all the industries across the spectrum, where the average bounce rate is 1.2%, the eComm industry has a lower overall bounce.
Email bounces are important to consider, as a high bounce rate can decrease your email delivery rate and impact your overall campaign performance.
One of the most efficient ways of reducing your bounce rate is by implementing a confirmed opt-in verification for your brand website. This will distill the genuine email IDs from the temporary/fake IDs, which are often entered by one-time shoppers.
You can also get your mailing list scrubbed using a verification and validation service to make sure that it is free from spam traps, typos, invalid ids, etc.
The last part is implementing an effective sunset policy, where the dormant users who have not checked your emails for the last 6 months need to say goodbye and be removed from your mailing list.
This allows you to maintain a clean list and improve long-term campaign performance.
338 out of every 100,000 users churn out for eCommerce brands
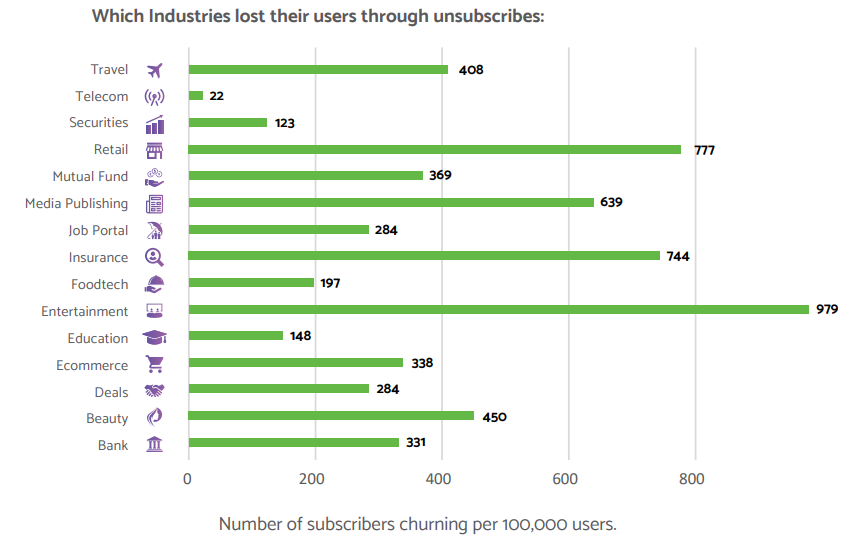
As a marketer, every subscriber in your mailing list is a potential business opportunity. If you don’t act on them and engage them through your relevant content then they might just switch over to your competitor. If 40% of your mailing list gets churned out, this could lead to a big loss on your revenue at the end of the year.
The eCommerce sector has fewer users churning out of every 100,000 compared to many other industries.
A few tips to reduce your churn rate further:
- Make every campaign valuable to your users and have content that generates clicks
- Use AI-tools to identify the right frequency to improve your email campaign performance over the longer term.
- Send emails at a consistent mailing frequency that has been tested with your audience. This gets your subscribers in the habit of seeing your emails on specific days
Friday is the best day to send out emails
Most industries benefit from sending emails on Fridays, and the eCommerce industry is no different. Of the many campaigns sent out over the week, Friday gave the best results.
Wednesday turned out to be the worst day to generate much engagement from the emails.
Fridays tend to cause a positive “weekend mood” that results in a higher engagement rate with certain types of emails.
The best day of the week is just an indication of what serves major brands. But your best day to send campaigns could be different, so test on different days and times and find your sweet spot.
The best-performing eCommerce email campaign saw a 36.92% open rate
Of all the analyzed campaigns run by the eCommerce industry, the best one generated a 36.92% open rate. While this is considerably lower than the other industries we examined, it is a 3.6x increase over the eCommerce industry average.
The subject line used for their best campaign was – A Note From Our CEO
This subject line speaks personally and doesn’t reveal the context. It tells the receiver that this is a message directly from a person they trust, but doesn’t mention what the message is. This is one of the reasons it received such an overwhelming response from its users.
Additionally, personalizing email subject lines showed a 30% increase in the average open rates.
On average, 11 emails are sent out per month
Brands within the eCommerce industry send out 11 emails per month, on average. The highest email frequency is 36 by the Deals/eCoupons sector.
As an eCommerce brand, you can make use of this information when you need to increase the number of emails you send out every month. Users are happy to get discounts in their inboxes and you can improve the engagement and the email frequency by including coupons in your future emails.
The Key to Email Success Lies in Understanding the Numbers
As marketers, we all know the importance of analyzing how our competitors are reaching our subscribers, customers, and potential customers.
Take the above email marketing statistics as benchmarks to build your email marketing program. Use these insights to strategize and create email campaigns to stand out from the rest.
Don’t forget to take a deeper dive into what we learned from studying over 100 billion emails that were sent out this past year from businesses around the world across all industries. Beyond the statistics, you’ll find actionable tips and tricks to increase your engagement.
Transform your marketing with the power of a customer engagement platform. Discover how to scale your efforts and achieve superior results—book a demo today
