


TL;DR
Tracking marketing performance in silos no longer works. To truly measure impact, you need omnichannel KPIs that capture the full customer journey, not just isolated touchpoints. Focus on metrics like Cross-Touchpoint CLTV, Cross-Channel Attribution, Retention Rate, Engagement Rate, and Blended CPA to understand real business outcomes.
This also means breaking down data silos and moving beyond single-channel reporting. With unified data and holistic measurement, you can see what’s actually driving revenue, optimize journeys in real time, and make smarter, ROI-focused decisions across every channel.
Let’s be honest. If you’ve ever tried to reconcile your paid social dashboard with your email platform with your CRM, you already know the problem: every tool claims credit for the sale, and none of them agree with each other.
Omnichannel marketing promises a seamless customer experience across every touchpoint. But measuring whether that experience is actually working requires a different set of KPIs, ones built for the way customers actually shop today, not the way your analytics stack is organized.
In this post, I’ll walk you through the five KPIs that matter most for omnichannel marketers, how to calculate them, and how to use the data to make smarter decisions rather than just fill dashboards.
Top 5 KPIs for Omnichannel Measurement of Marketing Efforts
The 5 essential omnichannel KPIs are Unified Customer Acquisition Cost (CAC), Customer Lifetime Value (CLV) across all touchpoints, Cross-Channel Conversion Rate, Incremental Return on Investment (iROI), and Omnichannel Retention Rate. Tracking these requires a unified data foundation to prevent double-counting and accurately attribute revenue impact across the entire customer journey.
To move beyond the general ROI metrics, marketing analytics practitioners must adopt formulas that account for fragmented user journeys. High-level definitions of core business metrics like CLV and CAC form the foundation of advanced marketing analytics, as noted by Harvard Business School. Here is how to apply them specifically to a cross-channel environment.
1. Cross-Touchpoint Customer Lifetime Value (CLTV)
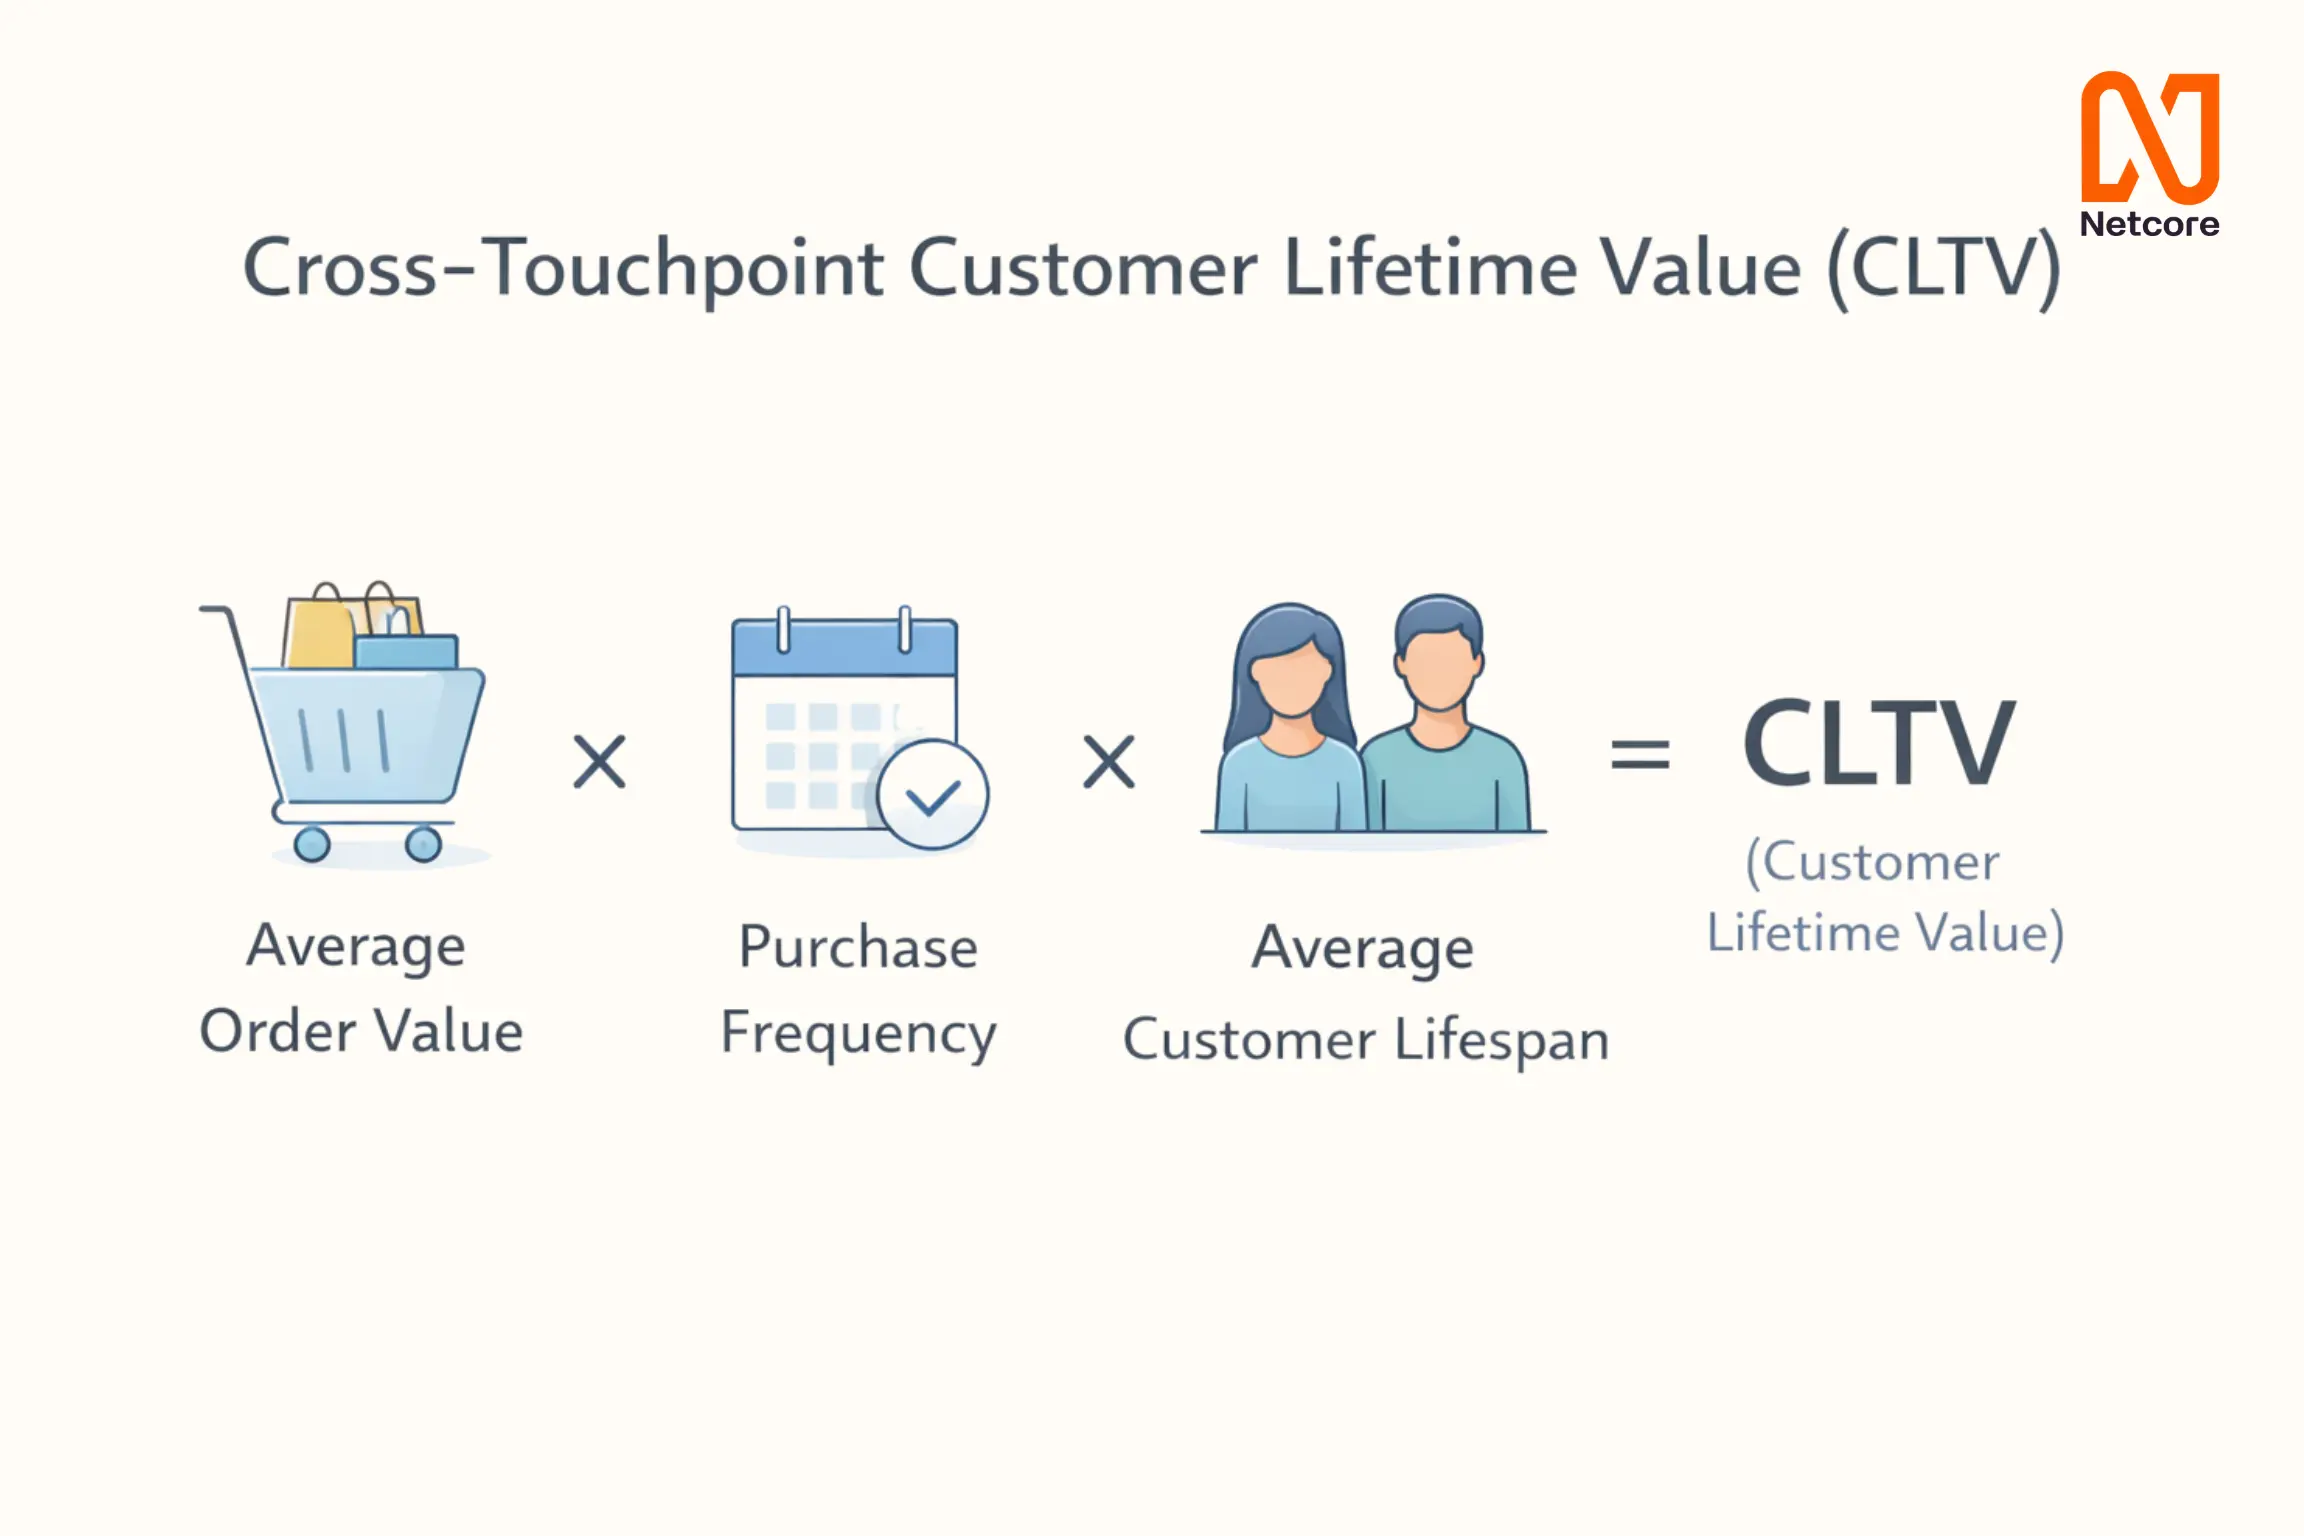
Why it’s the north star of omnichannel marketing. CLV measures the total revenue a customer generates across their entire relationship with your brand, across every channel, every order, every reactivation campaign. It is the only metric that naturally spans your entire omnichannel footprint.
A customer acquired via TikTok who later becomes a loyal email subscriber and repeat purchaser is far more valuable than your CAC from that first campaign suggests. CLV surfaces that value.
How to measure it in an omnichannel context?
The key is to calculate CLV at the customer level, not the channel level. Your CRM or CDP should be the system of record. Link every transaction, regardless of channel, to a single customer profile.
- Segment CLV by acquisition channel to understand which channels bring your most valuable customers (not just the most customers).
- Track CLV trajectory over 90-, 180-, and 365-day windows to catch churn risk early.
- Compare CLV between customers who engage across multiple channels vs. single-channel customers.
2. Cross-Channel Attribution Rate
Who really gets credit for the sale? Attribution is the most contested topic in marketing analytics, and for good reason. In a typical omnichannel journey, a customer might see a display ad, open three emails, browse the app twice, and then convert via a Google search. Last-click attribution gives Google all the credit and starves your email and app teams of budget.
Cross-channel attribution rate measures what percentage of your conversions are being properly attributed across the full journey, and which model you’re using to do it.
How Netcore Cloud Helps?
Multi-Touch Attribution Built Into the Platform.
Netcore’s Journey Analytics module visualises the full conversion path across email, push, web, and offline channels. Marketers can compare attribution models side-by-side and run A/B holdout tests to measure true incrementality, so budget decisions are based on actual lift, not last-click luck.
3. Customer Retention Rate
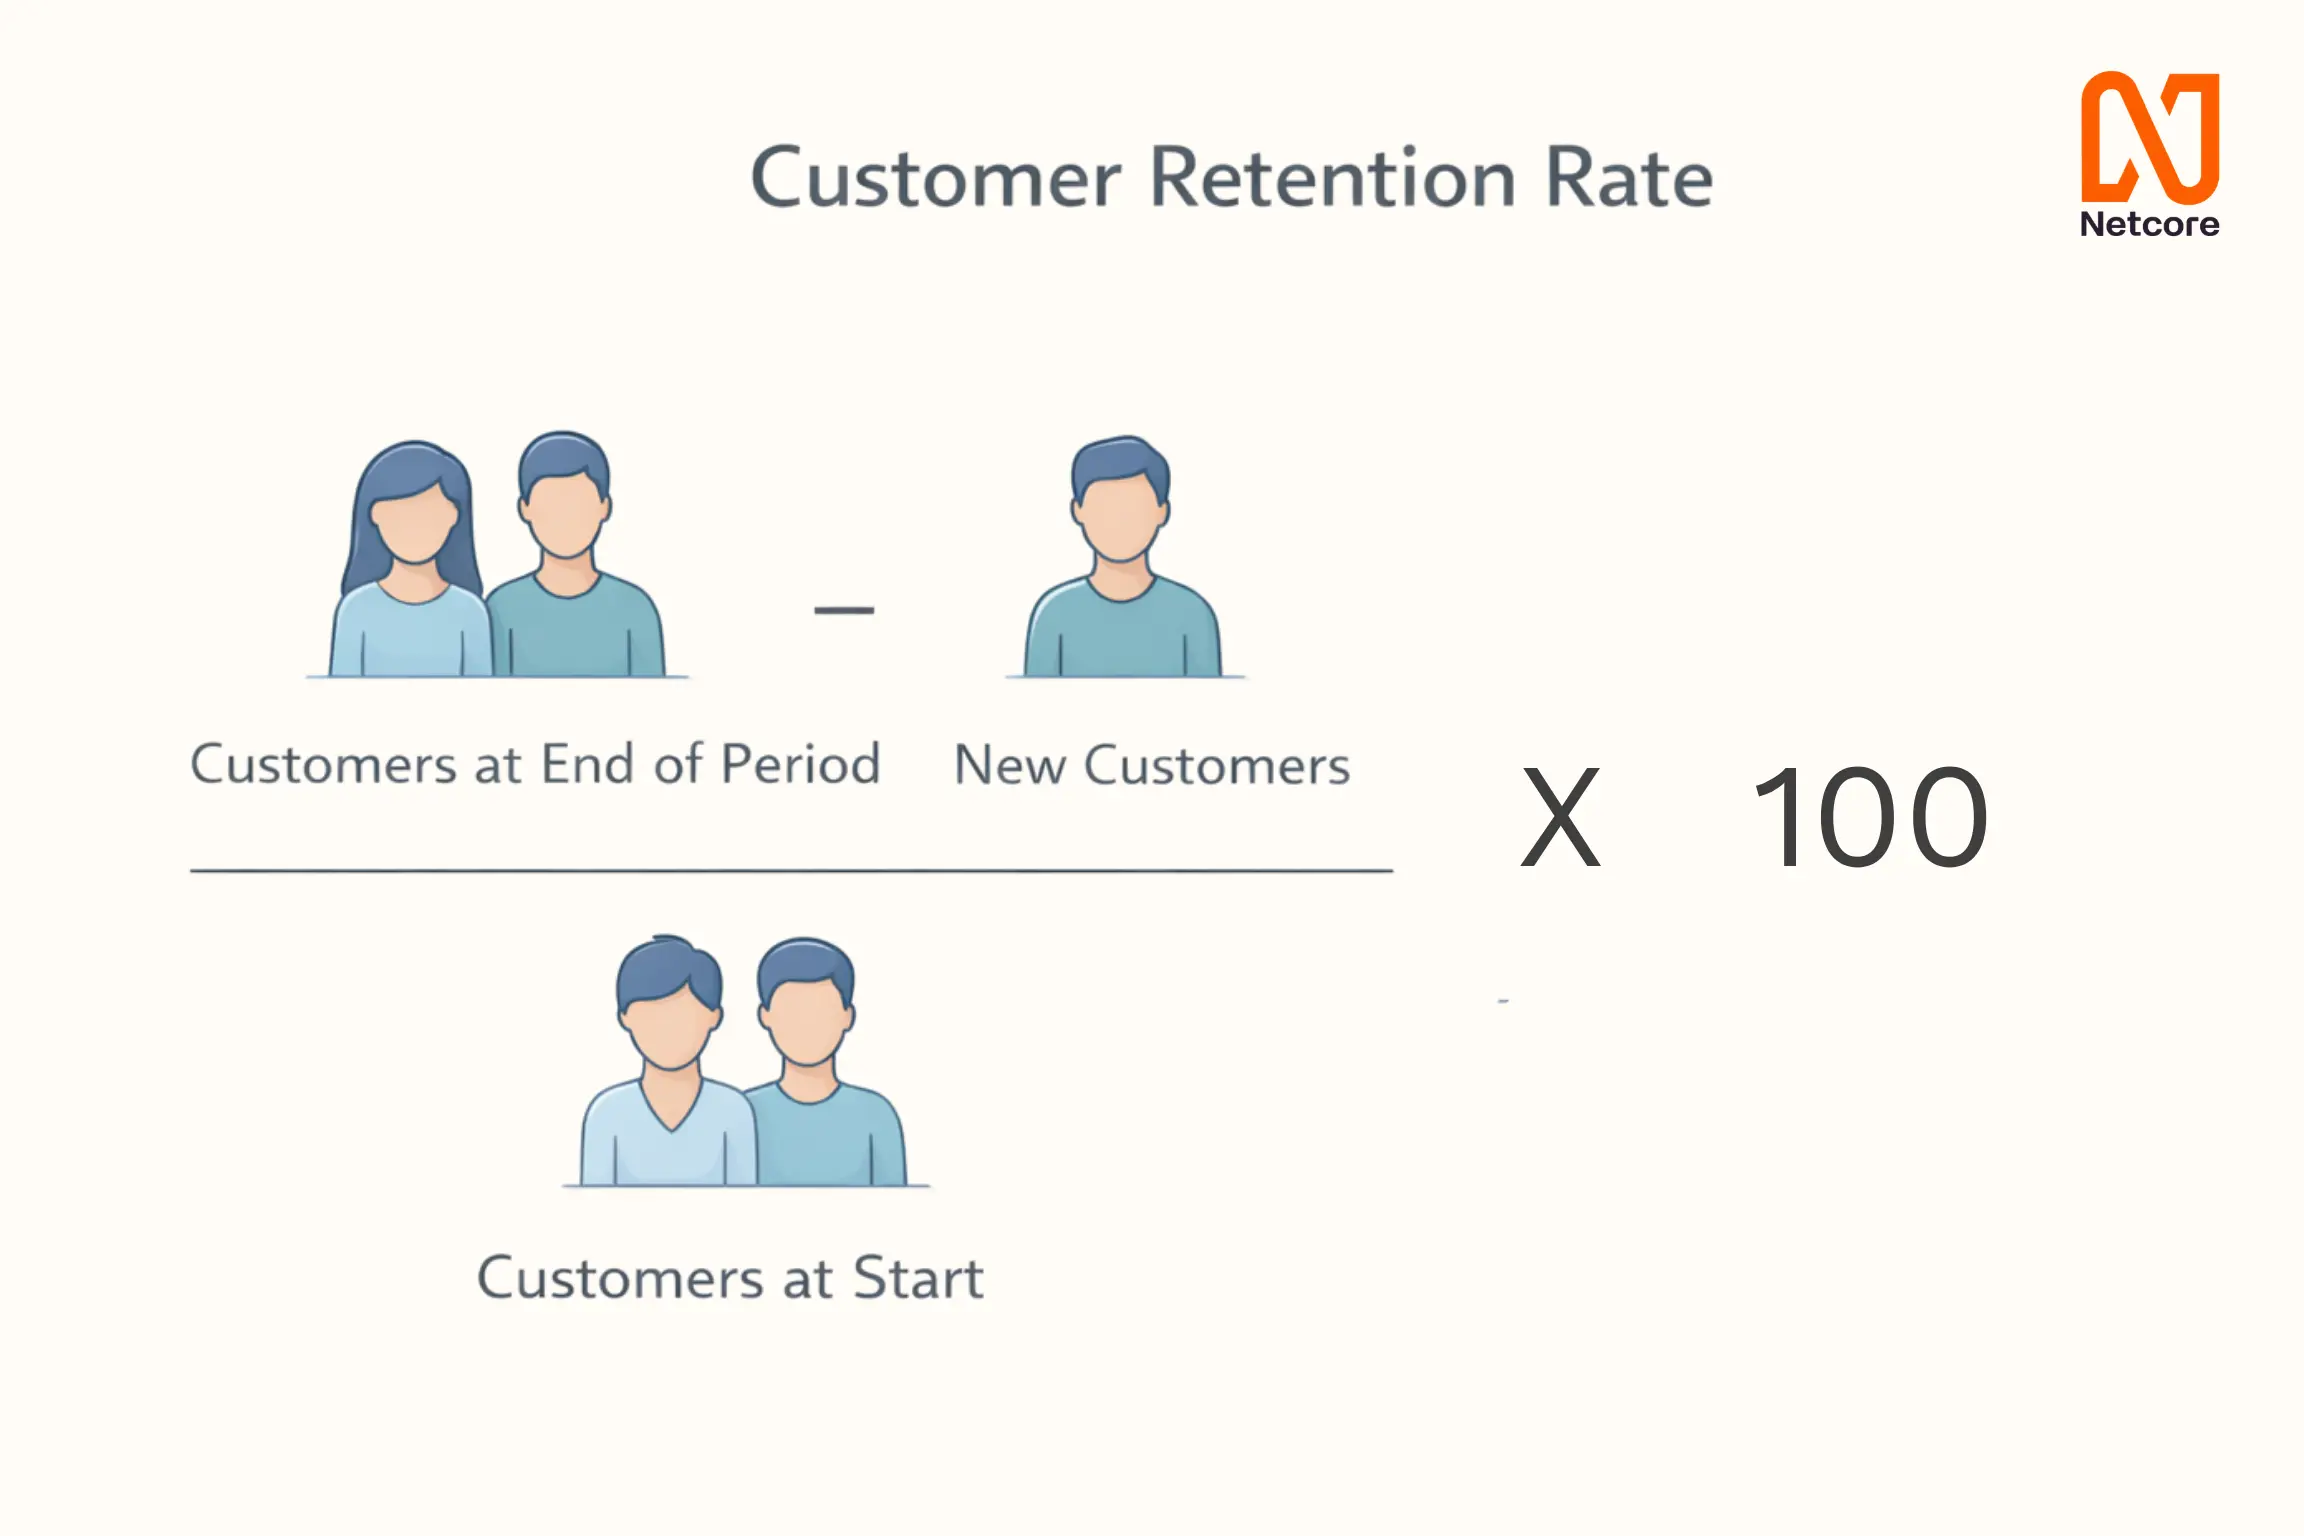
Acquisition is expensive. Retention is where omnichannel pays off. Customer retention rate (CRR) measures the percentage of customers who make a second, or repeated, purchase within a given time window. For ecommerce brands, it’s the clearest signal of whether your post-purchase omnichannel experience is working.
What omnichannel consistency does to retention?
Customers who receive consistent messaging across channels, the same brand voice, the same offer logic, the same level of personalisation whether they’re in the app or getting an SMS, retain at meaningfully higher rates. Inconsistency creates friction. Friction creates churn.
- Calculate CRR by cohort, segmented by primary engagement channel (email-first vs. push-first vs. SMS-first customers)
- Map the post-purchase journey for your highest-retaining cohort and replicate those sequences for lower-performing segments
- Set up win-back triggers at the 30, 60, and 90-day mark of inactivity with personalised offers based on last purchase category
- Track CRR in parallel with Net Promoter Score, they tend to move together and tell a richer story.
4. Omnichannel Engagement Rate
Engagement is not one number. It’s a composite. In a siloed world, marketers track email open rates, social engagement rates, and app session lengths as separate metrics. In an omnichannel world, you need a unified engagement score that reflects how actively a customer is interacting with your brand, across all of those channels combined.
This is sometimes called a “Customer Engagement Score” (CES), and it’s one of the most powerful leading indicators of both retention and CLV.
How to build a composite engagement score?
There’s no universal formula here, you’ll need to calibrate weights based on your own conversion data.
Run a regression on your historical data to see which engagement signals most strongly predict conversion and retention for your specific category, then adjust the weights accordingly.
5. Blended Cost Per Acquisition (CPA)
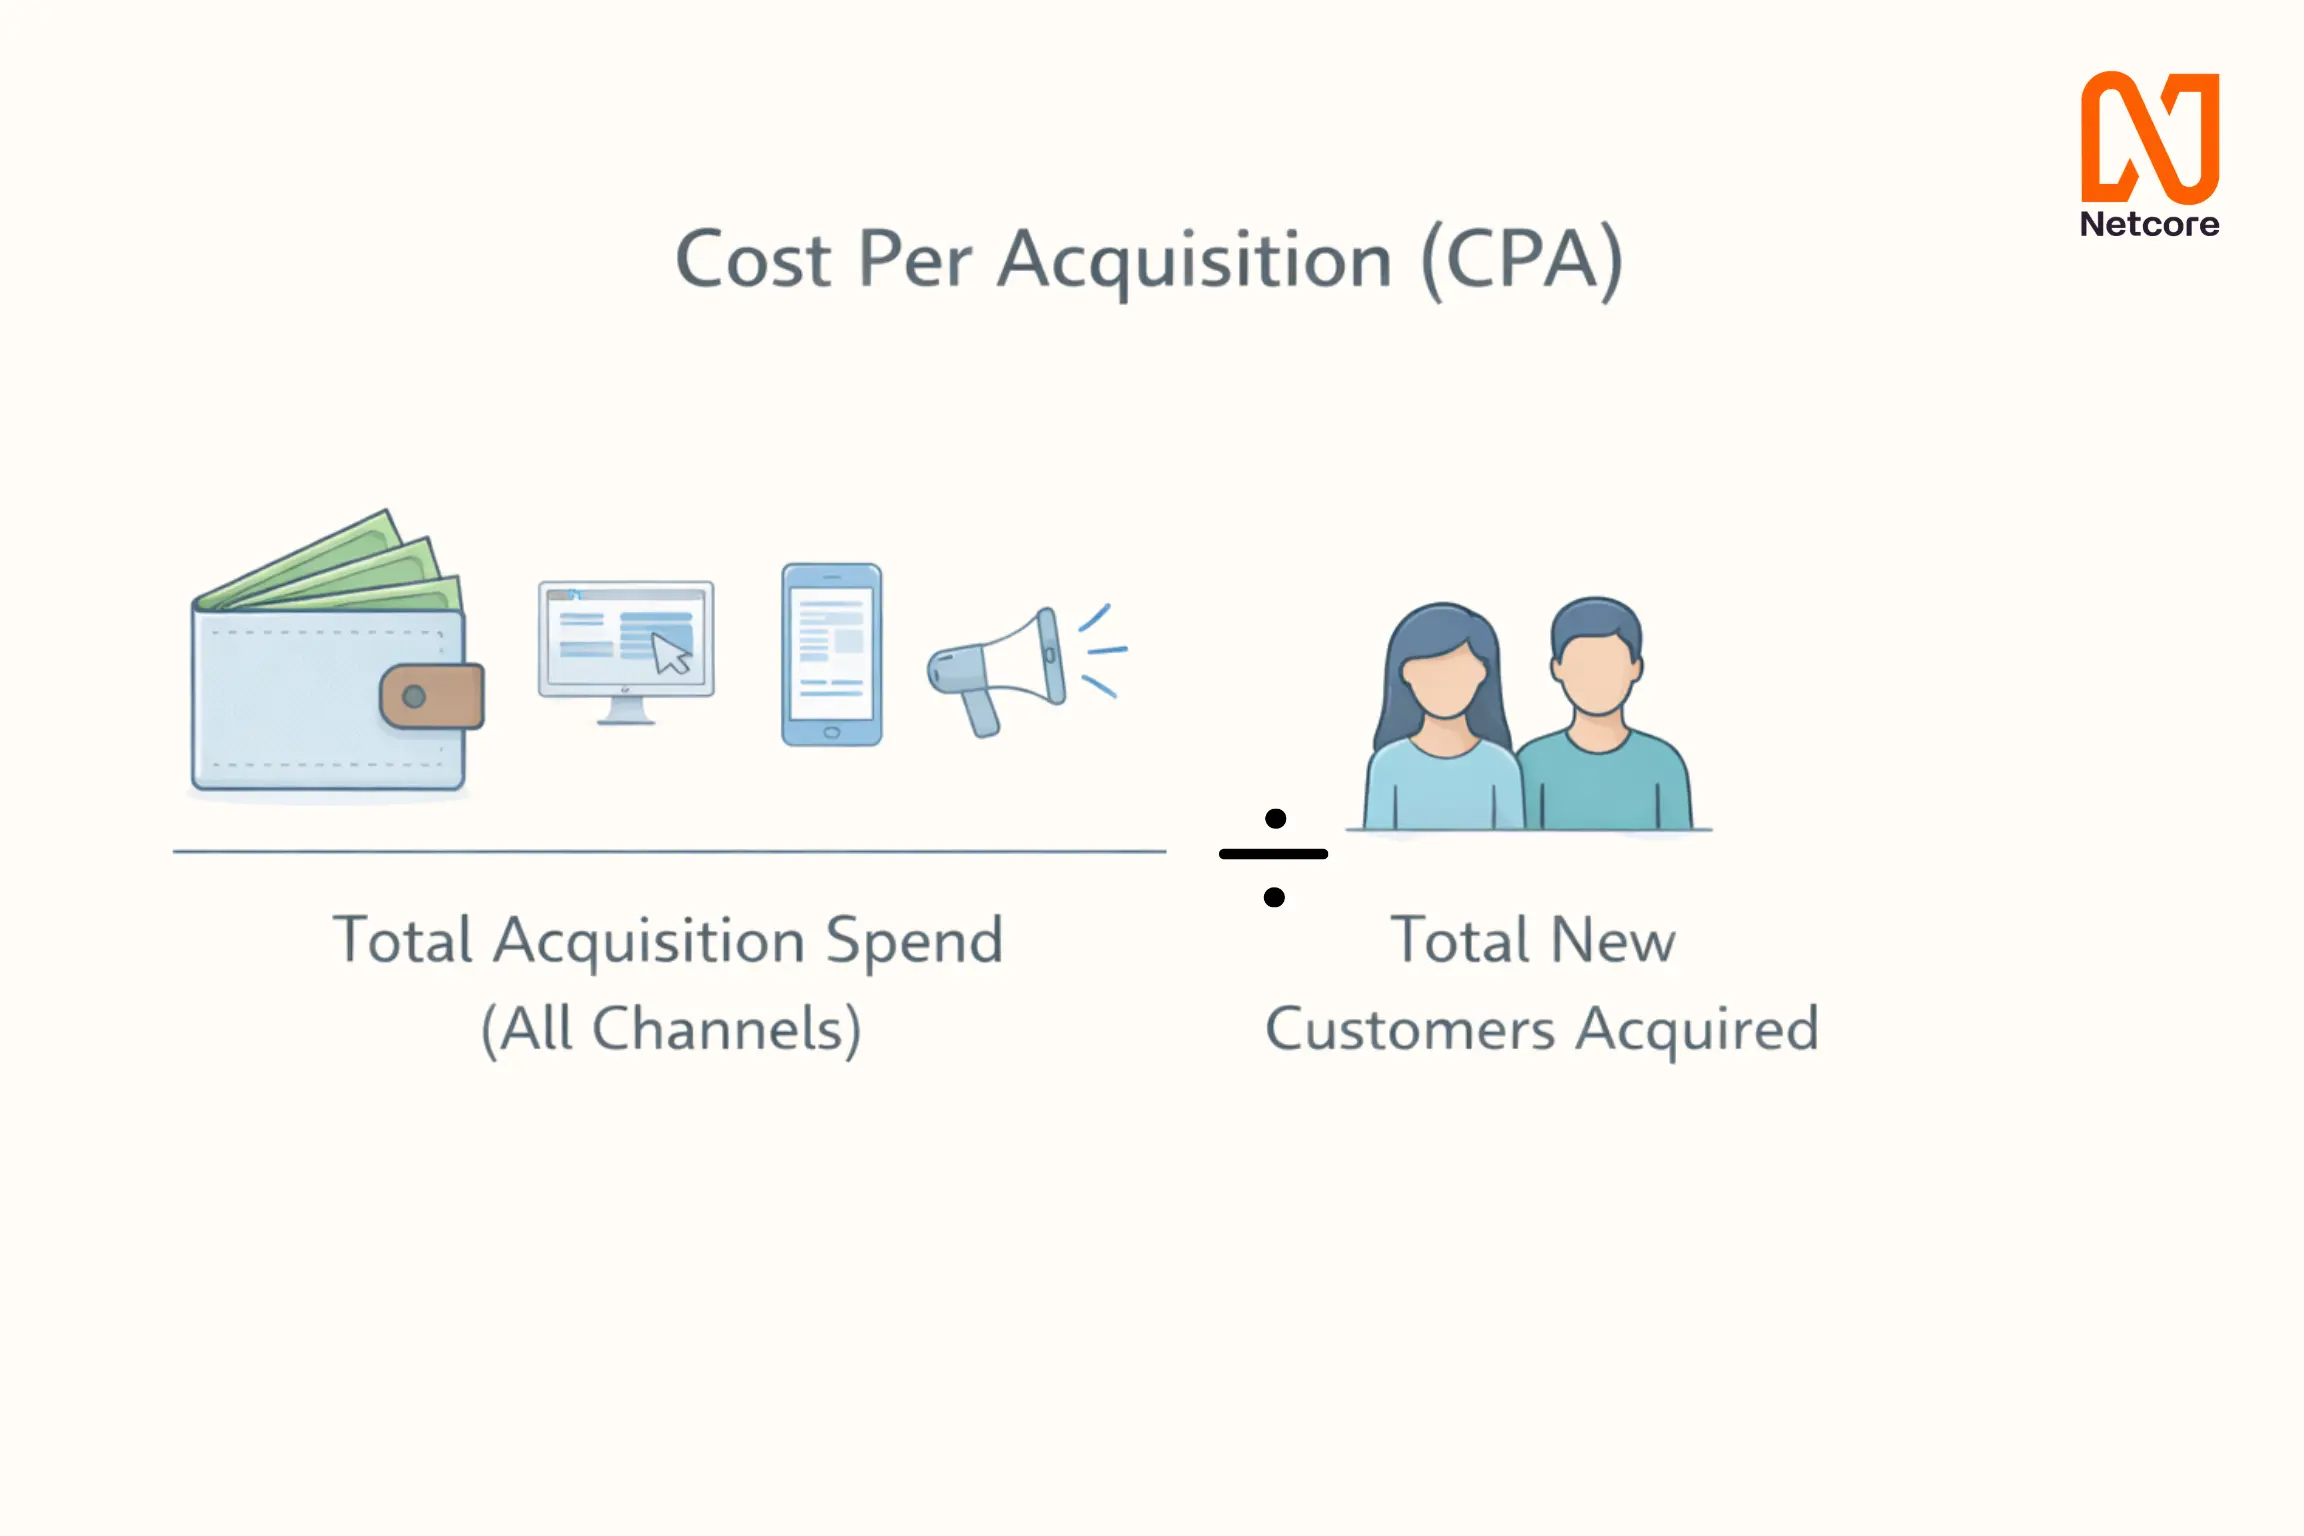
Optimising per-channel CPA is a trap. Here’s a scenario that plays out constantly in ecommerce marketing teams: paid search shows a CPA of ₹800. Email shows a CPA of ₹120. Leadership cuts paid search budget and doubles down on email. Three months later, overall revenue is down because email was converting customers who were already acquired, it just looked cheap because the hard work was done upstream.
Blended CPA, your total acquisition spend divided by total new customers acquired across all channels, protects you from this trap.
How to use blended CPA for smarter budget allocation?
- Calculate blended CPA monthly and track its trend, it should decrease as your omnichannel flywheel matures and organic/retention channels contribute more.
- Compare blended CPA against CLV to validate acquisition health: if CLV ÷ Blended CPA < 3, your acquisition economics need work.
- Use incrementality testing (holdout groups) on individual channels to understand their true contribution to new customer acquisition.
- Resist the urge to cut any channel purely based on per-channel CPA without incrementality data to back it up.
How do you Overcome Data Silos to Track Omnichannel KPIs?
Omnichannel KPIs are technically impossible to calculate without a unified data layer connecting your execution channels. Without a central hub, siloed platforms will inevitably double-count conversions, fracture user profiles, and misattribute revenue. To make these KPIs a reality, marketing leaders must integrate a Customer Data Platform (CDP) to serve as the single source of truth.
- Unify Identity Resolution
Configure your CDP to map fragmented identifiers like device IDs, email addresses, and phone numbers into a single, persistent customer profile. This ensures that when a user switches from SMS to the web, they are tracked as one person. - Ingest Event Data in Real-Time
Connect all data streams from your website, mobile app, email service provider, and offline point-of-sale systems. Real-time ingestion is critical for ensuring your dashboards reflect accurate, up-to-the-minute engagement data. - Apply Multi-Touch Attribution Models
Abandon legacy last-click models and implement algorithmic or multi-touch attribution logic within your analytics suite. This distributes fractional revenue credit appropriately across every touchpoint that contributed to the final sale.
How does Omnichannel Measurement go beyond Single-channel Metrics?
An omnichannel KPI fundamentally differs from a single-channel KPI because it accounts for the non-linear, multi-touch nature of modern buying behavior. Measuring vanity metrics like email open rates in isolation fails to connect marketing activity to actual business outcomes. True omnichannel measurement requires analyzing the entire sequence of touchpoints that lead to a transaction.
Consider a scenario where a user receives a push notification, clicks an SMS reminder, and eventually completes a purchase via desktop. Isolated reporting systems will claim three separate conversions, severely inflating your perceived success. Omnichannel measurement deduplicates this journey, proving that the orchestrated sequence drove the outcome, not just the final click.
Final Take
The brands winning at omnichannel right now aren’t the ones with the most channels, they’re the ones who measure the system, not just the parts. CLV tells you if you’re acquiring the right customers. Attribution tells you which channels are doing the real work. Retention shows whether your experience holds up after the first purchase. Engagement scores predict who’s about to churn before they do. And blended CPA keeps your acquisition economics honest.
Start with one KPI, CLV is the best place to begin, and build a measurement framework around it. Once you can see customers as unified individuals rather than channel-specific conversions, every other metric starts to make more sense.
The goal of omnichannel measurement isn’t to generate better reports. It’s to make better decisions faster, and to build the kind of customer experience that makes the metrics move on their own. Book Demo now to understand how Netcore has already helped leading brands achieve this at scale.


