


“An ounce of prevention is worth a pound of cure.”
This implies that addressing smaller challenges in a timely manner helps avoid bigger ones, saving money, time, and resources. This holds true in the business world too.
Digital and mobile marketing across industries and channels such as email, SMS, app push notifications, web push notifications, etc. is proving more promising in terms of ROI than the traditional means. In such an environment where a small slip-up can cause businesses to lose customers or competitive advantage, brands must consistently evaluate performance via their customer engagement platform, always staying attuned to shifts in the most pertinent KPIs.
Consequently, detecting anomalies – good or bad – and taking progressive or corrective action is critical to success.
What is anomaly detection?
Anomaly (or outlier) detection is a concept designed to find critical deviations in the business. It involves closely monitoring and analyzing data patterns in real-time through advanced customer engagement software to understand the trajectory of various business KPIs.
This process entails isolating the timestamp or periods that raise suspicion by differing significantly from the majority of data and not adhering to the overall data statistics. This same methodology is used widely in other industries such as:
- Fraud detection in BFSI
- Malfunctioning equipment in Manufacturing
- Infrastructure/material defect detection in Construction
- Sales or demand spike detection in Pharmaceuticals
- Engagement surge in Social media
Our definition of anomaly detection in terms of AI-led intelligent insights focuses on time series outlier detection. This involves gauging the data of certain Business KPIs in the right chronology and identifying the instances that don’t follow the common collective trend and seasonal/cyclic pattern of the entire data. In simpler terms, it involves identifying data-points that aren’t in the same trend as the data-points in the neighborhood. The anomaly could be seen in the form of unexpected drops or spikes, flat lines, or phase shifts.
Let’s understand this with a simple example:
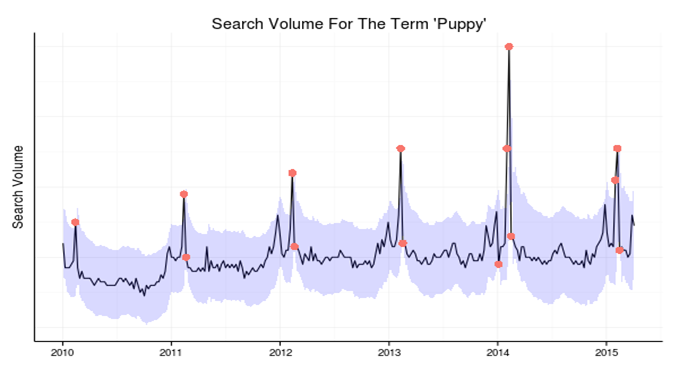
The above graph portrays a time series of search volume for the keyword – “Puppy” – in Google Search over the years. The bold points in red are the outlier events, i.e., the instances that don’t maintain the overall statistics within the data.
The highlighted area represents the lower and upper boundary of expected value of the search volume for a particular period. Detecting the instances that go beyond the expected boundary, i.e., breaking the general trend, seasonality, and statistics of the overall data is what Insights are designed for.
It’s a lot like identifying a needle in the haystack based on the historic trends in the time series data – determining if today is business as usual or something alarming that needs your attention.
How is anomaly detection relevant to marketers?
In today’s digital landscape, marketers often find themselves swimming in data but starved for actionable insights. This is where Raman’s AI-led intelligent insights come into play, functioning as a pivotal customer engagement platform. By highlighting unusual trends in crucial metrics, marketers can gain a deeper understanding of their audience’s behavior.
An anomaly in one area of business can often affect the performance in other areas. For instance: A low click-through rate (CTR) on your app push notification campaign could adversely affect the daily active users and hence, impact the revenue. Recognizing and addressing such an incident swiftly, armed with a robust customer engagement tool, can either mend a potential business flaw or even carve out a new competitive edge. The sooner that a marketer can identify this anomaly, the faster will he or she be able to take corrective action.
For instance: Let’s say that a marketer, on a particular day, observes:
- a fall in Revenue (vital metric)
- a surge in CTR
- a surge in Bounce Rate on the website
Though the Revenue should increase as there is an increase in the CTR for the campaign sent, it proves to be counterintuitive. The marketer then observes a spike in bounce rate for the web page. Connecting the dots, a marketer can conclude that there might be a disconnect in the website landing page and campaign advertisement content. This could be why a customer leaves the website without completing a transaction. Leveraging customer engagement software, the marketer can swiftly address issues by aligning future campaign content with the landing page, thereby optimizing ROI.
Raman’s AI-led intelligent insights harness the power of time series data from key business KPIs such as revenue, daily active users, app uninstalls, email open rates, CTRs, etc. This data, when aggregated daily, weekly, or monthly (depending on business needs) via a customer engagement solution, provides timely alerts about detected anomalies.
Our idea of intelligent insights is also extended to help the marketer understand the holistic picture about the business by including anomaly detection based on multiple time horizons such as 7 days, 14 days, etc.
For instance: A positive insight of revenue on a 14-day horizon signifies that the anomaly today is majorly based on the past 2 weeks of activity; i.e., compared to the two last weeks of revenue trend the revenue has significantly deviated from the normal. Whereas an insight on a 7-day horizon will indicate an anomaly within a week’s period. This way the marketer can be certain of period (in terms of strategy chosen) that has led to the uncanny behavior today.
Other key benefits that can be exploited via Raman’s AI-led intelligent insights include:
- Identify trends
- Discover the issue early
- Strategize a response well in time
- Mitigate impact on correlated business metrics
- Frame a business based on the new normal
- Gain cross-channel visibility
How does anomaly detection work in Raman’s intelligent insights?
Let’s first understand the types of time series anomalies. Anomalies in a business context fall into 3 categories:
- Global Outliers (Point): Value is far outside of everything in the dataset.
For instance: When we compare the flight bookings in post-COVID era to the pre-COVID era, its evident that the numbers fell significantly
- Contextual Outliers (Conditional): Value significantly deviates from the rest of the data-points in the same context. For instance: Uninstalls for an e-commerce app suddenly shoot up by 70% on a particular day. This is a sudden change that was not expected in that context
- Collective Outliers: When a group of data-points in a dataset are significantly different from the entire dataset. This behavior is often experienced when we combine different time series (KPIs) together and not when considered alone.
For instance: When a marketer launches a major transaction campaign there is an increase in the CTR and at the same time a decrease in revenue. Though these 2 events alone are not anomalies, but they collectively point to an error. There might be a possibility that the customers after clicking land on the transaction page and the page has a loading error, the payment gateway may have a problem, or the URL in the advertisement doesn’t redirect to the transaction page URL.
Our approach focuses on mainly finding the Contextual Outliers, i.e., the anomalies based on the context of the business KPI and the trend neighborhood of the data-points with regards to different time horizons. Though the approach is contextual, it can also be visualized as Collective as we have various vital metrics that affect the business and can be correlated to reach a conclusion.
There are various Machine Learning techniques that can be modeled for anomaly detection in a time series. These include the following:
- Maximize true positive and true negative count: Only categorize a true local spike as an anomaly
- Minimize false positive count and false negative count: Prevent categorizing a false focal spike as an anomaly
- Anomaly should be a rare event: Not every increase or decrease in relevant KPIs should be classified as an anomaly, but a significant change in percent should be flagged as one
Some of the algorithms that we explored before rejecting the same included:
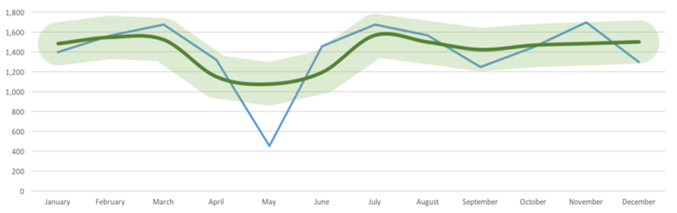
- Predictive modeling using time series forecasting: One way to find an anomaly in chronological data is to forecast the future value of a KPI based on the historical data, i.e., the trends and the seasonality.
Each forecast will have confidence bands which is then compared to the actual value of the KPI on a particular day. If the actual value falls out of the confidence interval, the KPI on that particular day can be categorized as an anomaly (positive or negative based on the direction). In the example below, the app uninstall count in May is an anomaly as its actual value falls out of the confidence band.
Though the above method proves to be a good indicator for the business problem, it didn’t serve our cause. The primary requirement for any time series forecast is historical data to learn from the past trends and seasonality. In our case, we decided to generate intelligent insights (triggered by anomalies) as soon as a new client started using our customer engagement platform, leaving us with limited data for any business KPI.
- Isolation forest: Built on the concept of ensembled decision trees, the trees in the isolation forest first separate the data based on random features and then a random split value between the minimum and maximum value of the selected feature.
Let’s take the example of a food delivery app (all outliers w.r.t 7-day horizon):
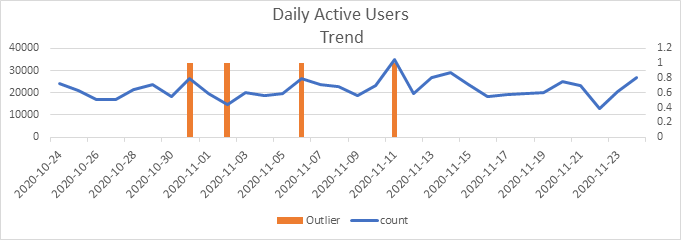
In this scenario, though 11th November (+60%) is classified as an anomaly, 22nd November (-40%) has been missed out. Other instances are only false positives.
Isolation forest is a good indicator of anomalies, but the number of false positives were on the higher side and this didn’t tie back to our objective of flagging only rare events.
- Local outlier factor (LOF): It is a density-based algorithm to find the anomaly. The calculation in this model looks at the neighbors (self-assigned) of the point in consideration to find out the average density ratio. If LOF >> 1, the density of the point is much smaller than its neighbors and hence, classified as an anomaly.
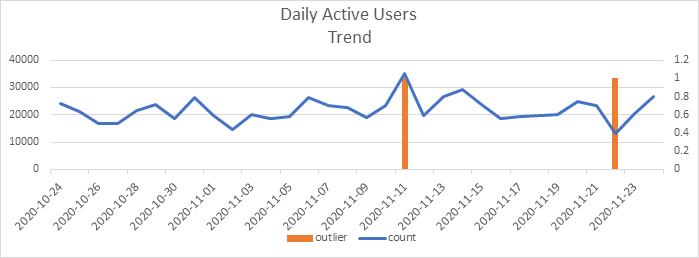
Let’s consider the case of DAUs for an e-commerce app (all outliers w.r.t 7-day horizon):
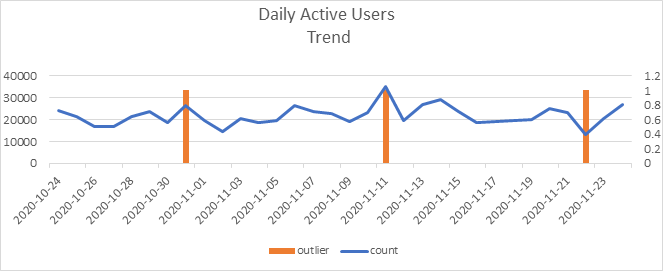
With the exception of 31st October (28%), the other two are perfectly classified as anomalies. Though LOF proved better than isolation forest for our business case, there are still some shortcomings with few false positives.
We tried other predefined unsupervised algorithms such as One Class SVM, DB Scan, GMM, Low Pass Filters, and other statistical methods such as Z-Score, Confidence Bands etc.
Our custom customer engagement solution outperformed individual algorithms, reducing misclassifications and enhancing the capabilities of our customer engagement software.
What’s next after anomaly detection?
Although a marketer can identify the reason for an anomaly, the process is very tedious and time-consuming, given the quantum of data and possibilities. But, that’s precisely what Raman aims to simplify on our customer engagement platform.
Raman offers diagnostic insights on exactly “why” a certain anomaly has been cited as an intelligent insight. This not only helps the marketer understand the business better, but also strategize for future.
Ready to see Raman in action and elevate your marketing game? Don’t miss out! Book a demo with Netcore today and witness firsthand how our customer engagement platform can transform your approach to data anomalies.
