


Online stockouts cost retailers $22B a year. Accurate data at your fingertips is crucial to making the right decisions for your online store. Questions like—Which of your products to procure more? Which ones to promote and which skews to drop? Inventory data siloed from marketing only add to the efforts in making sense of data.
Often, there is a lack of connection, insights, and a holistic view of how your SKUs perform with external data sources. Pulling, manipulating, and pushing data only adds to the inconvenience before you can finally take action to run campaigns or replenish your inventory.
A gap between inventory data and marketing
Do you have access to inventory data right in your marketing stack? A gap here affects your understanding of the link between marketing efforts and inventory. Lack of visibility when your top sellers run out of stock, you recommending bad performing products, or not recommending the best selling items all lead to a loss in potential sales.
In contrast, what if all your stock inventory and customer interaction data were built right into your marketing platform? And if you could take action on that data right from the dashboard. This paves a path to save you time and act on important inventory and sales data.
On that note, we are taking a step towards retail analytics by introducing Product Performance. Relevant data from your online store, all in one place beside your marketing stack.
Now, with numbers, you also get context and insights.
Netcore’s Product Performance for E-Commerce
With real-time visibility into the product catalog, marketers and category managers can make the right decisions faster and ensure optimal inventory management. Soon, with machine learning-based affinity segments, you can target the best audience by recommending showing or hiding the correct products from them.
With triggers for back in stock, price drops, and new arrivals, even your customers will be well informed.
Read more about Netcore’s Product Performance for E-Commerce here
A bird’s eye view of product performance
A bird’s eye view of all your key product metrics as a dashboard displays a holistic overview of your product portfolio. Whereas customizing lets you rearrange and view data that matters the most.
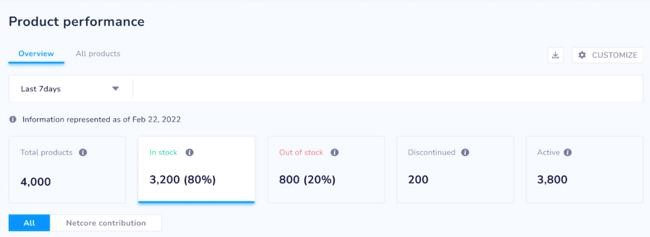
With an ‘overview’, you see total products, in stock, out of stock, discontinued, and products that are actively sold. Each of these data points also filters across all other views. You can choose to drill down into the specifics.
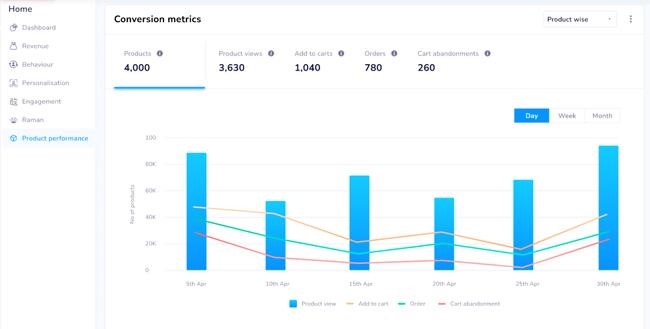
The conversion metrics display insights into your conversion funnels to understand how products from your catalog are performing at different stages. Namely, it shows the total:
- Products
- Views
- Add to carts
- Orders
- Cart abandonments
Download these charts as images or PDFs for your presentations and reporting.
Revenue and sales performance dashboards
Moving a step deeper into data, finance-oriented dashboards show visibility in revenue and sales performance.
| Revenue performance | Sales performance |
|---|---|
| Total revenue | – |
| Average daily revenue | Average daily sales |
| Revenue per click | Sales per click |
| Revenue per view | Sales per view |
Based on these performance metrics, you could remove products from promotions or your catalog altogether. With a clear understanding of the sales velocity filtered by day, week, and month, you could choose which products to promote, discount, remove or restock.
Store inventory and interaction trends
All of this would be incomplete without inventory and interaction trends. Inventory trends show the inventory added in stock and the total inventory sold in the selected time. Interaction trends provide insights into how customers engage with your products from view to purchase with click-through rates, cart-through rates, and conversion rates.
More contextual sales metrics
Platform data shows you the different device platforms your visitors are using for you to optimize their experience.
And for you to optimize your conversions, there is region-wise data that can be filtered more.
The overview also shows widgets for the top 10 and bottom 10 selling products, categories, and sub-categories. In all products, this expands to show more.
Even more product performance metrics
There are 20+ metrics available that are viewable in different levels like product, category, and subcategory. See everything from views to clicks to sales, product attributes, abandonment metrics, discounts, and pricing. Here too, customization lets you view only the metrics you want to see.
Further, filtering lets you drill down based on metrics and numeric values.
Learning more about your product performance at a granular level is a conversation away. No extra integration required. To know more, book a demo.


