


As ecommerce owners, diving deep into key ecommerce metrics is no secret for thriving and staying ahead. Without these metrics is as good as driving a car without any destination.
All Direct-to-Consumer (D2C) brands have two questions that need urgent answering:
- How do we get new customers to notice our brand?
- How do we increase the discoverability of and access to our products across platforms?
It all comes down to a behavioral science principle: Salience Bias.
In layman terms, this principle states that our brain prefers to pay attention to elements that are prominent or that emotionally resonate with us.
So, what makes something “salient”?
As marketers, we know the answer lies in understanding our customers – their needs and desires (both stated and unstated) and curating our products, services, and marketing campaigns in line with this.
According to Forrester, 89% of digital businesses are investing in it – Personalization!
The omnipresence of personalization is evident across the board, and one way to drive home that advantage is by strengthening your online presence through the power of ecommerce.
And stitching seamless offline and online retail experiences is critical in the current scenario.
Top 6 Ecommerce Metrics to Track
As customer-centric ecommerce brands, you can’t chase revenues without truly understanding your customers’ needs, wants, and preferences. And only once you’ve set that flywheel in motion can you double down on measuring and tracking the ecommerce metrics that matter.
But it’s also important to understand the impact of 1:1 omnichannel personalization on your entire funnel.

The best route to follow through this maze of “gauging performance” is to track the metrics that matter the most across your acquisition, conversion, and retention funnels.
Let’s break this down further:
Notice this graph:
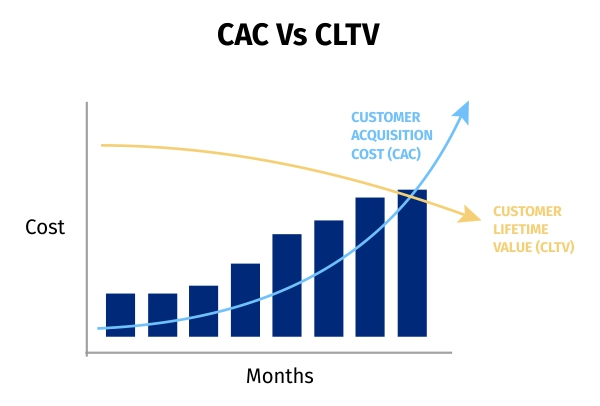
CAC is outstripping CLTV!
With the right 1:1 omnichannel personalization strategy in place, you can visibly see your CAC decreasing and your CLTV increasing over a period of time.
Here is a list of the metrics to keep track:
1. Average Order Value (AOV)
This is the average $ amount that D2C e-commerce customers pay for the products in their virtual shopping carts when they checkout.
For instance: Your long-time customer, Jack, used to check out with a cart value of $50. But now, after showcasing personalized product recommendations, data-driven upselling/cross selling, the cart value at the check-out page should be $100!
Below is the formula to calculate

The higher the AOV over a period of time, relative to a platform’s Daily Active Users (DAUs) and Monthly Active Users (MAUs), the greater the marketing ROI, revenues, and profits.
AI-led personalization can help increase the AOV by opening up opportunities for cross-selling and upselling through real-time 1:1 product recommendations of suggested items, “most commonly
purchased together” product bundles, etc.
Other strategies to improve AOV include
- Offer a free-shipping threshold
- Provide discounts on specific product categories or products
- Showcase time-sensitive deals that create a sense of FOMO!
- Set up an effective loyalty program that banks on gamification
- Incentivize the shopping experience through a referral program and social sharing
2. Add-to-Cart Rate
This is the percentage of customers who place at least one product in their virtual shopping carts during an active session.

Add-to-cart rates are important to track, since they can indicate the effectiveness of the product catalog, 1:1 recommendations, and website UI/UX.
Almost of customers that add a product to their cart, go on to 30-40% complete a purchase. So, ecommerce brands stand to benefit through an increase in revenue by increasing their add-to-cart rates.
AI-led product recommendations can actually increase add-to-cart rates by almost 6-9%. Moreover, triggered recommendations delivered across other marketing channels can help reduce the overall cart
abandonment rates as well.
3. Return on Advertising Spends (ROAS)
This metric offers ecommerce brands the opportunity to measure the effectiveness of their digital advertising campaign on channels such as paid search or social media marketing.

With AI-led personalization and 1:1 product recommendations, you can uplift your ROAS over a period of time.
For instance: An e-commerce platform that retails fashion apparel, has spent $2,000 on a Facebook campaign in a single month and the campaign results in revenues of $12,000 over the course of the month.
The ROAS in this case will be 6:1 ($12,000 divided by $2,000). This means that for every dollar spent on advertising on Facebook, the brand makes $6 in converted revenue. AI-led personalization and 1:1 product recommendations can uplift ROAS over a period of time.
4. Overall Conversion Rates
For a Direct-to-Consumer (D2C) brand, everything boils down to one main conversion activity, i.e. a purchase/sale.

A research by PWC uncovered that 12% of online shoppers choose their favorite retailer because of personalized offers.
Be your customers’ brand of choice, comfort, and convenience!
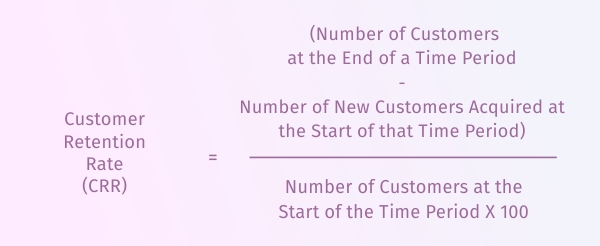
5. Customer Retention Rate (CRR):
This ecommerce metrics offers clarity on the percentage of existing customers that a D2C e-commerce brand can maintain over a period of time. The higher the retention rate, the higher the AOV, CLTV, and revenues.
Remember,
56% of online shoppers are more likely to return to a website that gives personalized product recommendations.
For most CPG brands adopting a D2C e-commerce model, a retention rate of 30-35% over 8 weeks is considered super-healthy.
AI-led personalization helps D2C brands build sustainable 1:1 customer relationships that encourages them to keep returning to the ecommerce platform. This has a direct impact on the CRR, driven by increased customer satisfaction and loyalty.
6. Customer Lifetime Value (CLTV)
This is the total monetary amount that an ecommerce brand will earn from customers over the entire lifespan of their relationship with the brand.
CLTV is a function of and has a direct correlation with:
- Average Order Value (AOV) = Total Revenue / Total Number of Completed Orders
- Average Purchase Frequency Rate (APFR) = Total Number of Purchases / Total Number of Customers
- Average Customer Value (ACV) = Average Order Value (AOV) / Average Purchase Frequency Rate (APFR)
- Average Customer Lifespan (ACL) = Total Customer Lifespans / Total Number of Customers
Let us keep it simple,

Remember, a smart omnichannel personalization will help you track these metrics and facilitate in reducing your customer acquisition costs by 50%, lift revenues by 5-15%, and increase marketing spend efficiency by 10-30%.
Conclusion
Understanding and monitoring the right ecommerce metrics is the cornerstone of any successful online business. These metrics not only provide valuable insights into customer behavior and preferences but also guide decision-making, helping to fine-tune marketing strategies, optimize user experience, and ultimately drive sales.
To truly scale your marketing efforts, consider leveraging a robust ecommerce marketing platform. Book a demo today to discover how it can transform your business.
Ensure you always deliver customer-centric, value-driven, and sustainable customer experiences at scale. Start today and master the perfect mix!
