


You probably know your close friends pretty well – their likes, their dislikes, where they shop, what brands they prefer, and why. You can probably even predict what they’re going to buy before walking into a store. This understanding of your close friends’ behavior that you possess is known as behavioral inference – which comes in handy especially when finding them a gift.
Wouldn’t it be great if you were able to apply behavioral inferences and insights to all your app users, creating a positive impact on your user engagement and retention rates?
According to a McKinsey report, brands that leverage user behavior data to generate behavioral insights outperform peers by 85% in sales growth and more than 25% in gross margin.
The likes of Amazon, Netflix, and Google have all built successful and sustainable businesses around a nucleus of user behavior data and analytics.
But don’t worry, you don’t need to be an internet giant to leverage the power of behavioral data and analytics to take your business to the next level.
Netcore is poised to guide businesses in this arena with our behavioral dashboard, part of our customer engagement software. To help you to apply behavioral insights to all your app users and still be able to tie it back to your KPIs.
The power of visualization
As important as analyzing your app user data is – you’ll be able to leverage its true potential only when the insight is organized in a manner that makes sense to you.
In this case, organizing or representing the data in a manner that you can easily tie back to your KPIs or conversion goals is the best method.
Our behavioral dashboard on our intelligent customer engagement platform does exactly that.
In this blog post, we’ll outline what our behavioral dashboard is capable of – step-by-step – to help you easily find answers to questions like –
“Where are my active users coming from?”
“Which app versions are my active users using?”
“How often are my users engaging with my app?”, etc.
Let’s get started
- App users – tracking metrics that matter
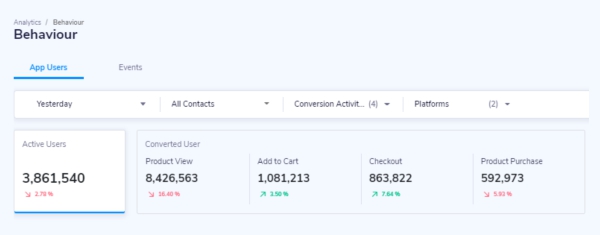
1. Define conversion activity
To begin with, it is critical that you define relevant conversion activities that you want to track.
For instance:
- A food delivery app’s goal would be to ensure that their users spend minimum time browsing for food and order food as quickly as possible – conversion.
Worst nightmare – a user comes on the app browses for more than 10 minutes and drops off.
Such repeated behavioral patterns among users is an indication to improve the app user experience and curate app journeys that will aid in easy and quick conversion.
- An OTT app’s goal would be to ensure that their users spend maximum time on the app to increase content consumption.
Worst nightmare – a user comes on the app, spends less than 5 minutes, and drops off without consuming enough content.
Such repeated behavioral patterns among users is an indication to improve app user experience and curate app journeys that will aid in discovering the right content for each user and repeated app usage.
Thus, it becomes imperative that you define your conversion events correctly.
2. Measure your app’s stickiness
“Let’s FaceTime”
“Xerox copies”
“Google it”
“Book an Uber”
The extent of the impact a brand has made on the consumer for them to use it in their normal day-to-day language or lives is a dream come true – stickiness.
But how can you measure your app’s stickiness?
There are 2 ways to go about it –
- Measure your app’s active users’ stickiness
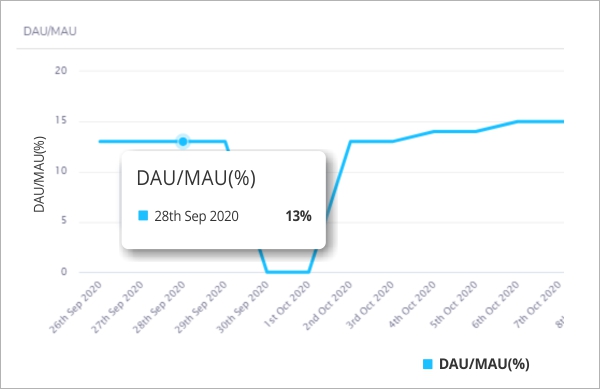
According to research, on average, across industries, 20% stickiness is considered good and 25% and beyond is considered exceptional.
- Measure your app’s converted users’ stickiness
A simple formula – Daily Converted Users (DCU) / Daily Active Users (DAU)
Our dashboard, a vital part of our customer engagement platform, presents both metrics. For each conversion activity that you define – our platform tracks the users who converted.
For instance:
In an e-commerce app – the conversion activity is product purchase.
Stickiness = Number of Users who Purchased a Product / DAU
P.S. The closer this number is to 1, the better is your app’s stickiness quotient.
Taking a closer look
1. How are my active users performing on my app?
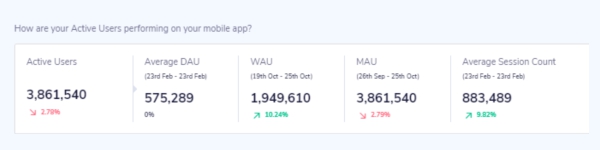
You can further track your active users on your app – hour-wise, daily, weekly, or monthly.
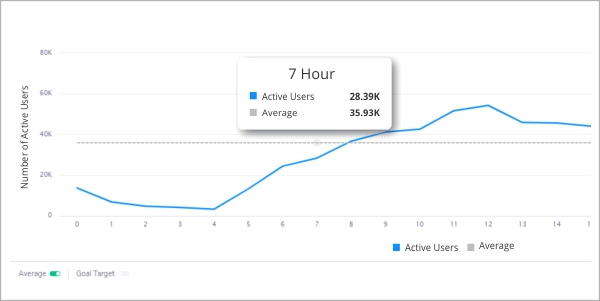
Comparison:
- Average comparison: Plots the line to the average number of app users (in this case hourly)
- Goal target comparison: You can set goals for each day, week, or month (Eg: Goal – 800,000 active users this month) and this graph will automatically plot how your app is performing in comparison to your goal
2. Who are my active users?
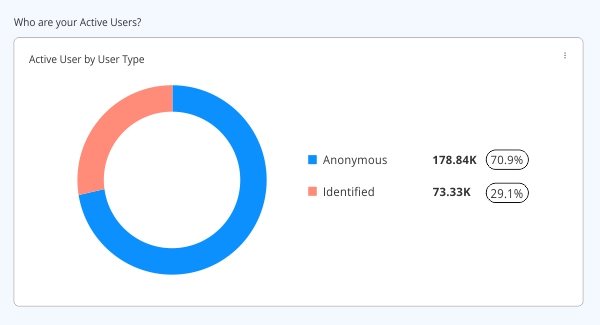
For some apps, login need not be mandatory during the initial user journey but becomes imperative for a conversion activity like – product purchase. This graph gives you a clear picture of the percentage of Anonymous Users vs Identified User.
Act on this insight:
With this insight, you can target campaigns or create impactful app user experiences to increase the percentage of identified users.
Additionally, be aware of which app version they are using and prompt them to update if necessary, using our customer engagement tool.
3. Which app version are my active users using?
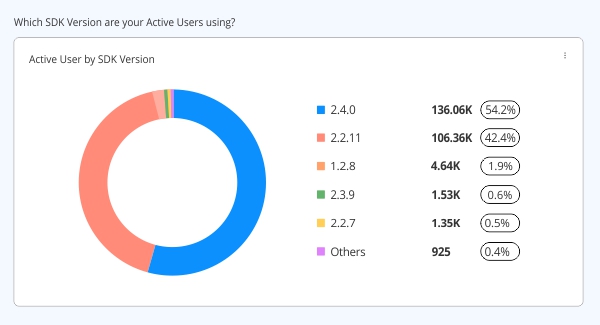
Act on this insight:
Drive campaigns using in-app notifications or app push notifications on-the-fly to nudge your users towards your latest app version.
B. Events – tie it back to your KPIs
Depending on your business goals, your app’s conversion goal will vary. Define them on our dashboard, part of our comprehensive customer engagement solution, to keep tabs on crucial metrics.
For instance:
In an OTT app –
Conversion activity – freemium to subscription model conversion, streaming, app launches, app’s active users’ stickiness, etc.
Let’s take a quick look at graphs for a few conversion events.
- Streaming
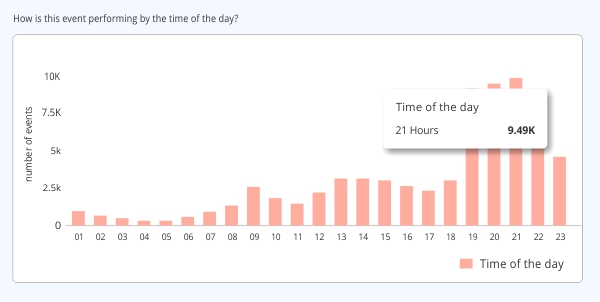
You can see during which time of the day your users are actively streaming content.
Act on this insight:
Nudge your users with personalized content recommendations during their preferred time to boost engagement and increase retention.
- Freemium to subscription model conversion
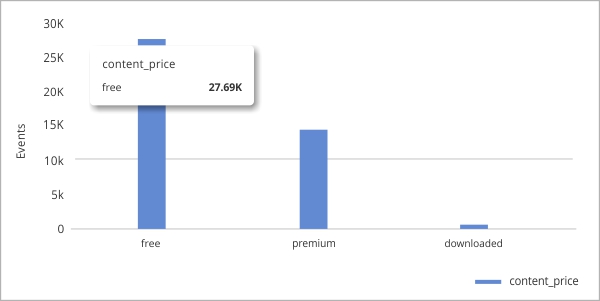
Act on this insight:
Nudge your freemium users with personalized content recommendations to convert them to consume paid content, thus ensuring more paying users on your app.
- Popular genres
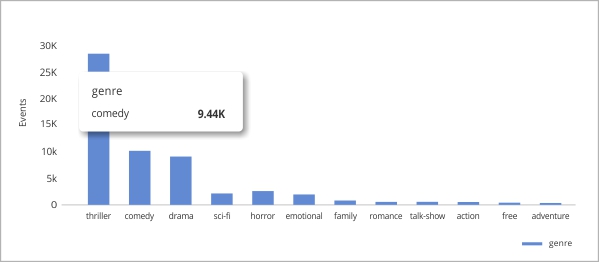
Act on this insight:
Let’s say with this graph you identify that your active app users are consuming “Thriller”, “Comedy”, and “Drama” as genres of content. This means that the content in these genres is performing well – nudge your first-time users or users who are most likely to churn towards these genres to increase the chances of retention.
Drive User Retention With In-Depth User Behavioral Analytics
According to research, 78% of users report bad experiences as a reason for churn, but only 1 out of 26 unhappy users put an effort to complain.
This means that 91% of those unhappy non-complainers simply leave.
You can’t rely on your users to raise a red flag in order to accurately gauge their experience, satisfaction, or to predict churn and retention.
As a marketer, empower yourself – spot the red flags through individual user behaviors, patterns, and trends. Stay one step ahead to ensure that you pick up on signs of trouble early, when there is still time to act, and not just react. For crafting a truly user-centric product experience, leverage our customer engagement solutions.
Conclusion
Understanding your users’ behavior on your app isn’t just about analytics; it’s about unlocking a goldmine of insights that can transform your business. Each click, scroll, and interaction is a clue, painting a vivid picture of your users and the intricate dance between them and your offerings. If you’re serious about constructing a truly customer-centric product, then integrating a customer engagement platform like Netcore is non-negotiable.
Our state-of-the-art customer engagement platform not only helps you understand these behaviors but also empowers you to act on them, cultivating an unmatched user experience. Imagine having a tool that not only deciphers user preferences but also molds your offerings to their desires. That’s the magic of a robust customer engagement platform.
Reach out to us and let our customer engagement platform pave the way to a deeper understanding and an enriched user experience.
