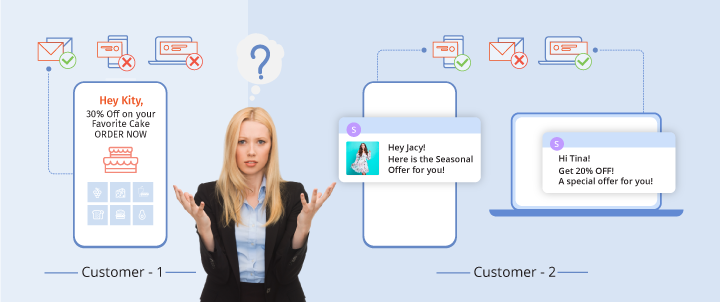
Marketers and analysts often come across questions like – “How to select the right target group”, “Who is the right audience for a marketing campaign” or even questions like “Who are the customers likely to make a purchase or do a holiday booking in the next 1 month”.
The crux is unless a marketer really knows which customer to focus on, the right marketing strategies cannot be defined!
What we discussed above is not a trivial problem to solve. Let’s look at an example – “How to select the right audience for an email campaign?”. A simple way to tackle this is, to target the last 90-day email engagers. But is this approach intelligent enough to help you drive your marketing objectives? We will look at a few limitations of this approach below –
- Marketers generally have a defined budget. If there is a budget to target only 1M customers but the marketer finds 2M 90 day email engagers, how to select the best 1M to target out of 2M? Random selection is not a wise choice here.
- At the end of the day, marketing campaigns are meant to drive higher revenue. The audience engaging with email campaigns does not necessarily end up generating revenue. We need a way to identify prospects who will engage with emails as well as make a purchase, to achieve the prime marketing objective.
- Here are some more open questions that remain unanswered
- How to understand which activities and events are to be given a higher priority
- Is recency more important than frequency always?
- Which customer may be the right audience for the email campaign?

We can have a long list of such questions, which are difficult to answer by analyzing just a few data points.
Multidimensional deep data exploration, pattern learning, and predictive framework are required to address them – something which Netcore’s “Predictive Segments” is really good at.
Predictive Segments look at the data in the form of a graph and a sequence at the same time, understand dominant patterns, and can predict the likelihood of a desired activity in the future.
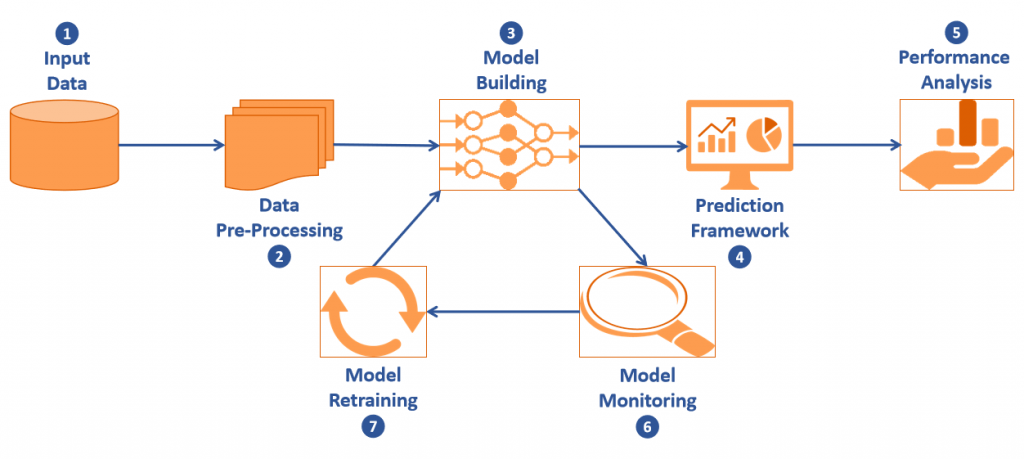
Let us have a look at the components of the robotic arm of predictive segments :

- Input Data :
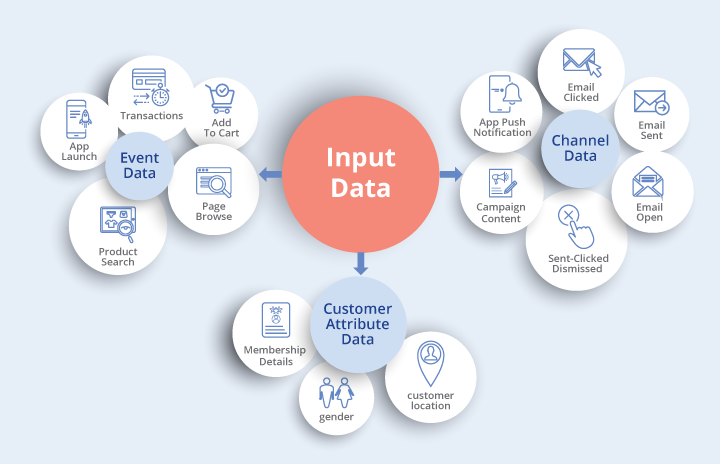
All events, channel, and customer attribute data becomes a part of our input. Event data includes details around activities done on the website and/or app like – Page Browse, Product Search, Add To Cart, App Launch, Transactions, etc.
Channel data includes details regarding campaigns – Email Sent-Opened-Clicked, App Push Notification Sent-Clicked-Dismissed, Campaign Content, etc.
The campaign content information is extracted in a model consumable format using our “Campaign Smart-Tagging” Module. A detailed description of what is this feature and how it works can be found here.
Customer attribute data provides details around customer location, gender, membership details, etc. Not all clients share similar data with us, but our models are perfectly capable to tune themselves according to the data shared. However, more and richer data means better performance of our models and hence higher marketing ROI.

- Data Pre-Processing
The magic starts from this step. Keeping aside the general activities like data cleaning, handling outliers, feature selection, etc. the recipe to success lies in how we present the data to our models such that our models learn patterns looking at it as a graph of interconnected events as well as a sequence of events at the same time.
- Model Building
We have a stack of models over here – CNN, Bi-LSTM, Feedforward network, etc. all types, where the final predictions come from the combination of cherry-picked models based on our custom-built NAS layer. NAS or Neural Architecture Search is an advanced concept in Deep Learning which helps in designing the most optimal Neural Net architectures. Though quite a few NAS techniques exist in the AI community today, we needed something more cost-effective than the more popular ones available.
Stay tuned to this space, for more on this amazing concept of Neural Architecture Search(NAS) and a literature review of commonly used techniques.
- Prediction Framework: Predictions are generally given in two ways :
- Likelihood Categories: Based on predicted probabilities, customers are ranked ordered and allocated to three different categories – “Most Likely”, “Fairly Likely” and “Least Likely” to perform a desired activity.
- Top N / Bottom N: Predictions can also be given in form of Top N or Bottom N customers, likely to do an activity based on user inputs. N in this case is user input.
- Performance Analysis
The performance of “Most Likely”, “Fairly Likely” and “Least Likely” categories are primarily measured based on precision and impact on business KPIs. “Most Likely” category will have a higher precision than “Fairly Likely”, which in turn will have higher precision than “Least Likely”. We will understand what is Precision from the example below :
Out of 10M customers targeted, Raman categorizes 2M as “Most Likely”, 3M as “Fairly Likely” and the remaining 5M as “Least Likely” to open the campaign. Let’s assume, from each of these categories (in the same order) – 1.5M, 1.5M, and 1M open the campaign. Based on this data :
The business impact is generally arrived at based on how Predictive Segments was used to add value :
- Enhance ROI by reaching out to a well-researched micro-segment, thus boosting performance by decreasing costs
- Increase Topline, by suggesting additional customers and drive marketing objectives like revenue, open rate, CTOR, etc.
There is another measure called “Recall” often used by data scientists to measure model performance. From the above example, Recall of “Most Likely” category can be calculated as (Open Count) / (Total Open Count) = (1.5M) / (1.5M+1.5M+1M) = 37.5%.
More on “How to choose the right methodology to measure model performance” in a separate blog coming soon.
We use “Recall” as a secondary measure because this can depend on the number of people a marketer can reach out to based on the budget available. Whereas Precision helps the marketer decide how much to spend based on the ROI.
- Model Monitoring
Due to changing Data Distributions and Patterns, over time model performance can start getting impacted. We pro-actively monitor our models to capture the slightest changes in data and patterns and retrain the models if necessary to ensure supreme prediction quality always.
- Model Retraining
It is advised to re-train models only when it is needed. Not re-training models for an indefinite period can lead to degradation in performance, while re-training too frequently can make the model susceptible to random intervention effect and also increases costs of maintaining the model. Three important reasons why model re-training is needed are :
- Covariate Shift: The input data distribution changes. The reasons could be known or unknown. Example – A week-long sale period on an E-Commerce Platform, can boost customer events data like Page Browse, Add To Cart, Purchase, etc. significantly from a few weeks before the sale week to a couple of weeks after the sale ends due to enthusiasm buildup, follow up on orders placed, pre-bookings, etc. This is a known phenomenon but does not occur every week or month or after a pre-defined period always. Also, if the E-Commerce platform has similar sale weeks every year it can not be estimated with certainty the kind of impact it may have on business or the duration of buildup and spillover effects.
- Confidence Drift: A scenario where the relation between input variables and target variable changes over time. Sometimes the impact can be so much that some of the more important variables for predictions are no longer relevant. The model then starts giving poor predictions as the relations it learned and based on which it predicts are no longer valid. In such a situation, the Target variable is what we try to learn and predict, for example – In a churn prediction problem, the churn status of a customer(Yes/No) becomes the target variable.
- Prior Probability Shift: This happens when the target variable distribution changes. For example – Churn% increases or decreases significantly. Not all models are impacted by this, but the probability cut-offs and thresholds often need recalibration to categorize customers into “Most Likely”, “Fairly Likely”, and “Least Likely” buckets to perform a desired activity.
Model retraining can essentially be done in two ways, based on which of the above three broader scenarios impact the model and how. The model monitoring script understands the changes and triggers the right retraining technique :
- Transfer Learning – Model is trained on the new data set and gets fine-tuned being exposed to the newer trends in data. The weights learned and relations may change between predictors and target. However, the models already learned, their architecture, and hyper-parameters are not updated majorly.
- Re-Learning – This is basically, the model building step executed from scratch and models selected, their architecture and hyper-parameters can change after this activity.
Our end-to-end AI pipeline is built using Python and Vertica. Apart from adding to the efficiency of our data processing scripts and queries, Vertica also has a lot of analytical functions for building ML models as well as doing statistical analysis. We have leveraged many of these analytical functions in our “Data Pre-processing” scripts. Vertica also allows integrating Python and SQL-based codes to run on top of Vertica cluster and Vertica installed nodes as UDX/UDFs, thus leveraging the power of cluster computing without paying for additional resources. We use this flexibility to train our Pytorch based models on one of the bigger Vertica-enabled nodes.
Keen to know more about this? Stay tuned for a series of blogs coming soon!


