


Here’s a scenario every marketer knows too well: Your November campaign generated 10,000 new sign-ups. Flash forward three months, and only 15% are still active. Meanwhile, your January cohort, which is half the size, shows 40% retention at the same milestone.
What’s the difference? Without cohort analysis, you’ll never know.
This is precisely why we’re excited to introduce Cohorts as part of our Analytics 2.0 launch. It’s not just another analytics feature; it’s your window into why customers behave the way they do, and more importantly, how to turn those insights into revenue.
What Are Cohorts, Really?
A retention cohort is:
A group of users who performed a starting action during a defined time period — and are then tracked over time to measure repeat behavior.
This is NOT just a segment.
This is behavioral time tracking.
For instance:
- Users who installed the app in Week 1 → How many returned in Week 2, Week 3, Week 4?
- Users who made their first purchase in January → How many repurchased in 30 days?
- Users who subscribed → How many renewed after 90 days?
- Users who installed → How many uninstalled within 14 days?
Instead of looking at averages, you track behavior cohort by cohort over time.
That’s where real insights live.
Why Cohort Analysis Changes Everything
1. Stop Guessing, Start Knowing
Aggregate metrics tell you what happened. Cohort analysis tells you why it happened and who it happened to.
When you see overall retention dropping, is it:
- Recent users churning faster?
- Long-term customers becoming less engaged?
- A specific acquisition channel bringing low-quality traffic?
Cohort analysis gives you the answer and the roadmap to fix it.
2. Identify Your Real Winners (and Losers)
Not all customers are created equal, and cohort analysis proves it with data:
- Premium vs. Free trial cohorts: Which converts better at 30/60/90 days?
- Mobile vs. Web cohorts: Where should you invest development resources?
- Campaign A vs. Campaign B cohorts: Which drives long-term value, not just vanity metrics?
3. Predict the Future Based on the Past
Cohort analysis isn’t just historical, it’s predictive. When you understand which behaviors in the first 7 days lead to 90-day retention, you can:
- Optimize onboarding to drive those behaviors
- Flag at-risk users before they churn
- Project Customer Lifetime Value (CLV) with accuracy
The Netcore Cohorts Advantage
Most cohort tools stop at showing you pretty retention curves. Netcore CE’s Cohorts feature goes three steps further:
- Unbounded Cohort Analysis
Most analytics tools force retention into predefined windows — Day 7, Day 30, Day 90 — and stop there.
Netcore removes those limits.
With Unbounded Cohorts, you can analyze retention across extended time horizons without caps. That means you can:
- Track long-term retention beyond arbitrary time windows
- Analyze repeat purchase behavior over months (or years)
- Understand lifecycle decay patterns
- Measure subscription durability with precision
This capability is critical for industries where user value compounds over time:
- BFSI
- Travel
- EdTech
- D2C subscription brands
- Gaming
When customer value unfolds across long journeys, your analytics shouldn’t expire early.
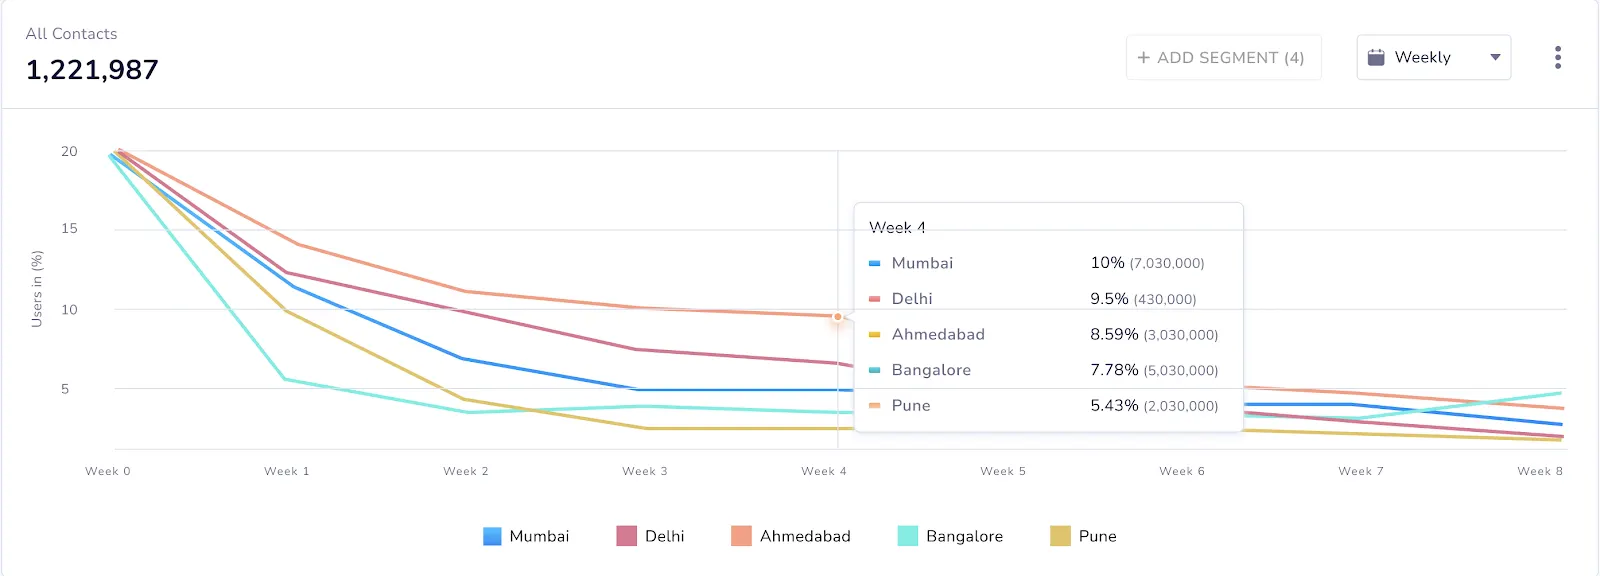
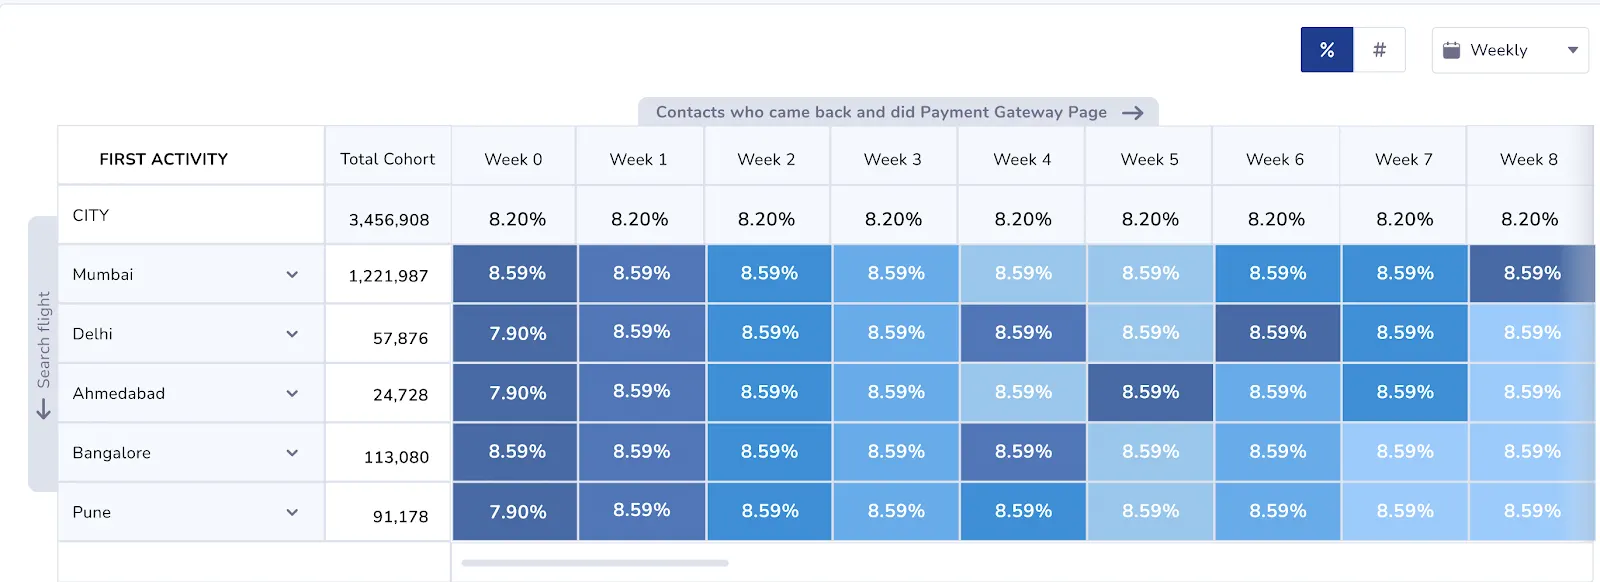
- Drill Down by Attributes (Go Beyond Retention %)
Seeing “30% retention” is useful.
Knowing why it’s 30% is powerful.
Netcore allows you to drill down cohort performance by multiple dimensions:
- User attributes (City, Age, Gender, Tier)
- Device (Android vs iOS)
- App version
- Acquisition source
- Custom properties
- Technographic data
For example:
Week 4 retention shows 25%.
Drill down reveals:
- iOS retention: 41%
- Android retention: 19%
Now you don’t just have insight — you have direction.
Retention stops being a static metric and becomes a diagnostic tool.
- Common Activity Payload Support
Most cohort tools only analyze retention by event names.
Netcore goes deeper.
You can build cohorts using common activity payload parameters, allowing you to measure retention tied to real business behavior.
Example use cases:
- Repeat purchase by product category
- Retention by cart value range
- Install → Uninstall by app version
- Subscription renewal by plan type
- Gaming retention by level completed
This shifts the question from:
“Did they come back?”
To:
“What did they come back for?”
That’s not just engagement analytics — that’s revenue intelligence.
- Plot Cohorts for All Users or Specific Segments
Retention doesn’t behave the same across your entire user base.
Netcore lets you run cohort analysis across:
- Entire user base
- RFM segments
- High-value users
- Campaign-acquired users
- Geography-based segments
- Loyalty tiers
You can compare:
- Paid campaign installs vs organic installs
- Premium plan users vs free users
- Metro cities vs Tier 2 cities
Retention becomes a strategic lever — not just a reporting metric.
- From Insight to Action — Instantly
Most cohort tools stop at charts.
Netcore doesn’t.
From within the Cohort panel itself, you can:
- Save users as a segment
- Create a campaign
- Download users
- Check channel reachability
No exports.
No switching tools.
No operational friction.
Insight → Action → Revenue.
Real Retention Cohort Use Cases
- E-commerce / D2C: Repeat Purchase Analysis
Create a cohort of users who made their first purchase in a specific month.
Track:
- Repurchase behavior over 30/60/90 days
Identify:
- Which acquisition month drives the best repeat rate
- Which product category drives higher second purchase
- Which cart value band retains better
Action:
Trigger targeted reactivation campaigns for users who haven’t repurchased by Day 21 — before churn sets in.
- App Businesses: Install → Uninstall Tracking
Create a cohort:
Users who installed in Week X.
Track:
- Uninstall rate over the next 14 days
Drill down by:
- App version
- Device type
- OS version
You might discover a specific Android version driving 2× higher uninstall rates.
Action:
Launch in-app engagement journeys and push nurture campaigns for the at-risk cohort while engineering fixes the root issue.
- BFSI: Activation Cohorts
Cohort:
Users who opened a savings account in January.
Retention metric:
Completed first transaction within 30 days.
Compare:
- Branch-acquired users
- Digital-acquired users
Action:
Trigger activation nudges for low-performing acquisition cohorts to accelerate time-to-first-transaction.
Retention here directly impacts revenue realization.
- Subscription Businesses: Renewal Cohorts
Cohort:
Users who subscribed in Q1.
Track:
- Renewal rate after 3 months
Drill down by:
- Plan type
- Price tier
- Geography
Action:
Deploy pre-renewal retention campaigns targeting drop-off clusters before subscription expiry.
Cohorts help you predict churn — and prevent it.
- Gaming: Engagement Depth
Cohort:
Users who completed Level 1.
Retention metric:
Completed Level 5 within 7 days.
Drill down by:
- Device
- Geography
- Referral source
This reveals which segments experience onboarding friction.
Action:
Optimize tutorials, difficulty curves, and reward pacing for segments showing early drop-offs.
Retention isn’t just about return visits — it’s about progression depth.
Success Stories: Cohorts in Action
Pepe Jeans: From Guesswork to 2.6X Conversion Growth
The Situation: Pepe Jeans, the iconic denim brand with presence across 60+ countries, was struggling with generic targeting and low repeat purchases. Their WhatsApp campaigns had a concerning 76:1 send-to-conversion ratio, indicating massive inefficiency.
How They Used Cohorts: Pepe Jeans leveraged Netcore’s Cohorts module to identify repeat-purchase patterns, tracking user behavior week-over-week. These cohort insights were then mapped to RFM segments, enabling them to:
- Pinpoint which customer groups showed repeat purchase potential
- Design targeted retention campaigns for high-value RFM cohorts
- Identify optimal timing windows for engagement
The Results:
- 2.6X uplift in conversions
- 57% improvement in funnel efficiency (WhatsApp deliver-to-conversion ratio improved from 76:1 to 33:1)
- 11X ROI on WhatsApp campaigns
- 1.8X increase in engagement rates
“We used Netcore’s Cohorts module to identify repeat-purchase patterns, tracking how users repurchased week-on-week. These insights were then mapped to RFM segments, allowing us to design targeted campaigns for top RFM groups driving higher repeat purchases and overall revenue growth.” — Ashutosh Patkar, Sr. Manager Ecommerce, Pepe Jeans
Plum Goodness: 140% Jump in Repeat Purchases with Cohorts + RFM
The Situation: Plum Goodness, India’s leading clean beauty brand, was seeing organic repeat purchases but lacked the advanced segmentation to maximize revenue impact.
How They Used Cohorts + RFM: Plum combined Cohort Analysis with RFM segmentation to uncover repeat purchase patterns and build micro-segments. By analyzing cohorts week-over-week, they identified:
- Which customer groups were most likely to repurchase
- Optimal timing for reactivation campaigns
- Category and product affinities by cohort
They then layered these insights with 25+ RFM micro-segments for precision targeting across WhatsApp, RCS, SMS, and App Push.
The Results:
- 130% uplift in website repeat purchases (Aug vs Oct)
- 140% uplift in app repeat purchases (Aug vs Oct)
- 1.7X increase in revenue from repeat purchases
The combination of cohort-based insights and RFM segmentation transformed Plum’s approach from broad targeting to behavior-led precision marketing.
The Bottom Line
Every day without cohort analysis is a day you’re flying blind. You’re making decisions based on averages that hide the truth about what’s really driving or killing your retention and revenue.
With Netcore CE’s Cohorts feature, you get:
✅ Precision segmentation based on shared behaviors and attributes
✅ Time-based tracking to spot trends before they become problems
✅ Deep drill-downs to understand the “why” behind the numbers
✅ Instant actionability to launch campaigns without leaving the platform
Ready to Unlock the Power of Cohorts?
The Cohorts feature is now live in Netcore CE’s Analytics 2.0.
Here’s what to do next:
- Log into your Netcore CE dashboard
- Navigate to Analytics > Cohorts
- Create your first cohort analysis in under 5 minutes
- Discover insights you didn’t know existed
- Turn those insights into revenue-driving campaigns
Your customers are trying to tell you something. Cohorts help you hear them loud and clear.
Want to see Cohorts in action? Request a personalized demo or check out our complete documentation to dive deeper.
#Analytics2.0 #Cohorts #CustomerRetention #DataDrivenMarketing #NetcoreCE


