


Most funnel tools tell you where users drop off. Netcore’s Analytics 2.0 tells you why and what to do about it. Track total conversion attempts (not just unique users), drill down by AI-powered affinity, compare performance across time, and launch campaigns directly from insights. Early adopters like Pepe Jeans have improved funnel efficiency by 57%, achieved 2.6X conversion uplift, and delivered 12.8X ROI.
You’ve seen traditional marketing funnel analytics before. They show drop-off rates. Conversion percentages. Maybe a breakdown by device or geography.
But here’s what they don’t show:
- How many times users actually tried before converting (or giving up)
- Which products or categories drive the highest conversion rates within your funnel
- Whether your campaigns are getting more or less efficient quarter over quarter
- Which channels you can actually reach users on before you launch a campaign
In short: most funnels are reporting tools, not decision engines.
For the past year, we’ve been rebuilding our analytics platform from the ground up. Today, we’re introducing Analytics 2.0; starting with a complete reimagination of Funnels.
Here’s what changed, and why it matters.
What Makes Analytics 2.0 Funnels Different
1. Track Total Conversions, Not Just Unique Users
The Old Way:
Traditional funnels only count unique users. So if someone adds a product to their cart three separate times but purchases only once, most analytics tools only show “1 conversion.”
The Analytics 2.0 Way:
We track every attempt, not just unique users.
If a user adds an item to the cart three times before finally completing the checkout, our Funnels records this as:
3 cart adds → 1 purchase, giving you a 3:1 efficiency ratio.
The funnel considers “add to cart” as a starting point, meaning that every additional touchpoint becomes part of the broader conversion story.
Why This Matters:
By counting every attempt, you can finally find out”
- How many add-to-carts does it take to drive one purchase?
- How many email campaigns does it take to drive one purchase?
- Are users getting stuck, or just taking their time?
- Is our messaging becoming more or less efficient over time?
This perspective turns each micro-action into meaningful insight, helping you diagnose friction long before a purchase ever happens.
Use Case:
For an ecommerce store, identify how many emails/WhatsApp messages/product views/add to carts it takes before a purchase. Let’s say it’s 10:1. Compared to the previous month, it was 11:1, and the previous quarter, it was 15:1. This means there’s progress—you’re on the right track.
Analytics 2.0 automatically calculates how many actions lead to one conversion.
Example:
- 1,000 product views → 200 add-to-carts = 5:1 ratio
- 200 add-to-carts → 50 purchases = 4:1 ratio
Track these ratios weekly to identify when efficiency improves (good creative, better targeting) or degrades (campaign fatigue, seasonal dips).
See How Channels Contribute to Conversion Efficiency:
With Funnels 2.0, your efficiency ratio now gives you a channel-level view of how hard each channel has to work to drive a conversion—making it far easier to compare performance and optimize spend.
- Calculate cost-per-conversion by channel, not just at the campaign level
- Spot which channels require more touches (emails sent, ads shown, notifications triggered) before a user converts
- Set realistic volume and budget targets by seeing which channels consistently deliver efficient paths
- Prove ROI by showing how channel efficiency improves over time—even when raw conversion volume stays constant
If your efficiency ratio was 10:1 last quarter and a particular channel is now converting at 6:1, that channel has become 40% more efficient, even if total conversions haven’t changed. This is the kind of insight only channel-level funnel tracking can reveal.
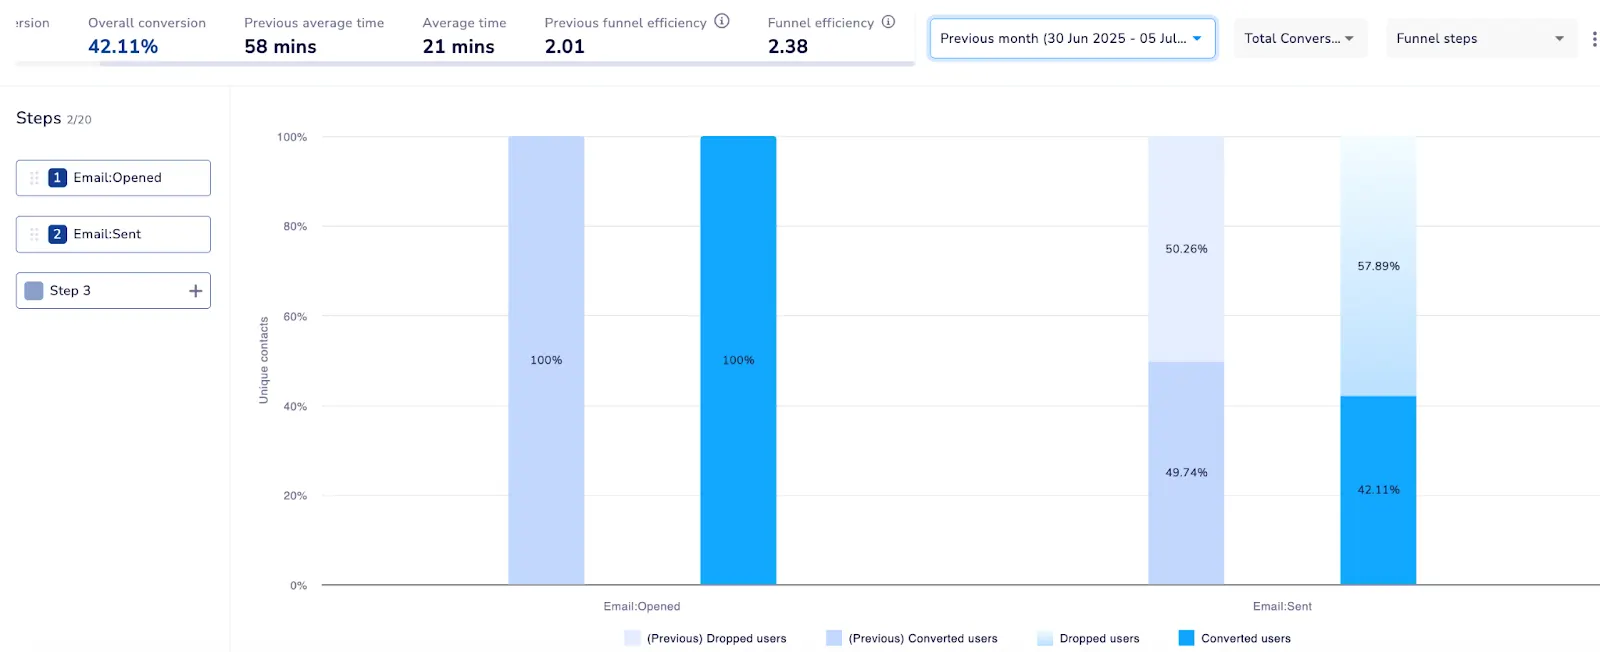
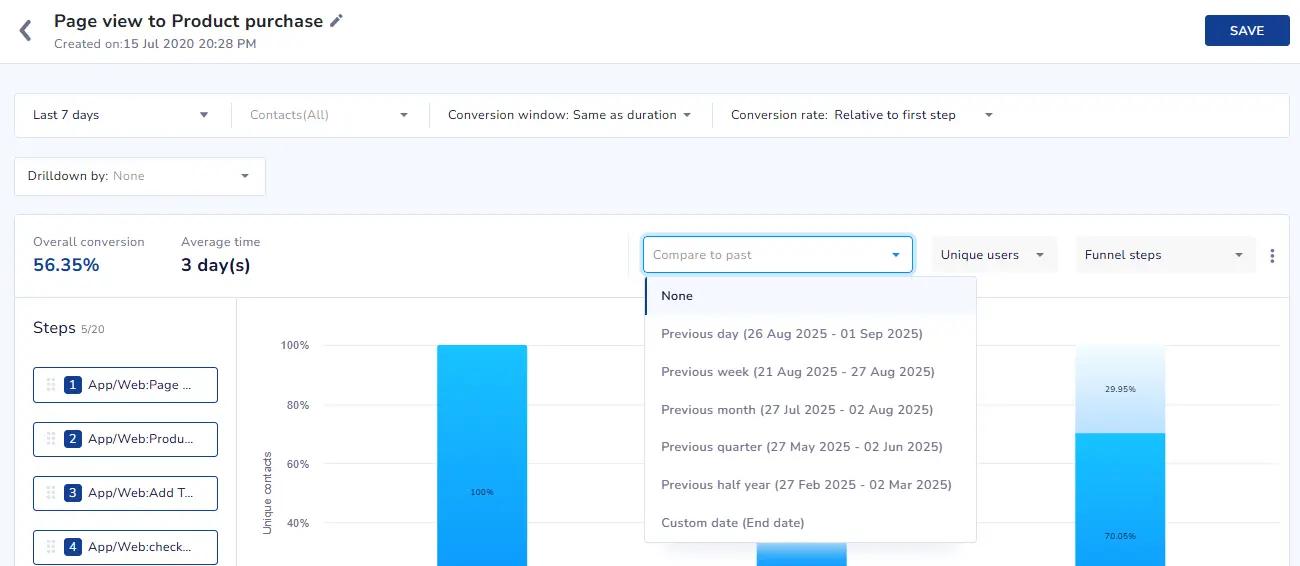
2. Compare To Past Performance To Validate What’s Working
Marketing performance is constantly evolving. Campaigns naturally lose momentum, audience fatigue sets in, and seasonal shifts change what people care about. Creative that performs brilliantly in January may completely fall flat by March as user intent, trends, and external factors move on.
Analytics 2.0 lets you compare any funnel against:
- Previous day, week, month, quarter, or half-year
- Custom date ranges
- Same period last year (for seasonal businesses)
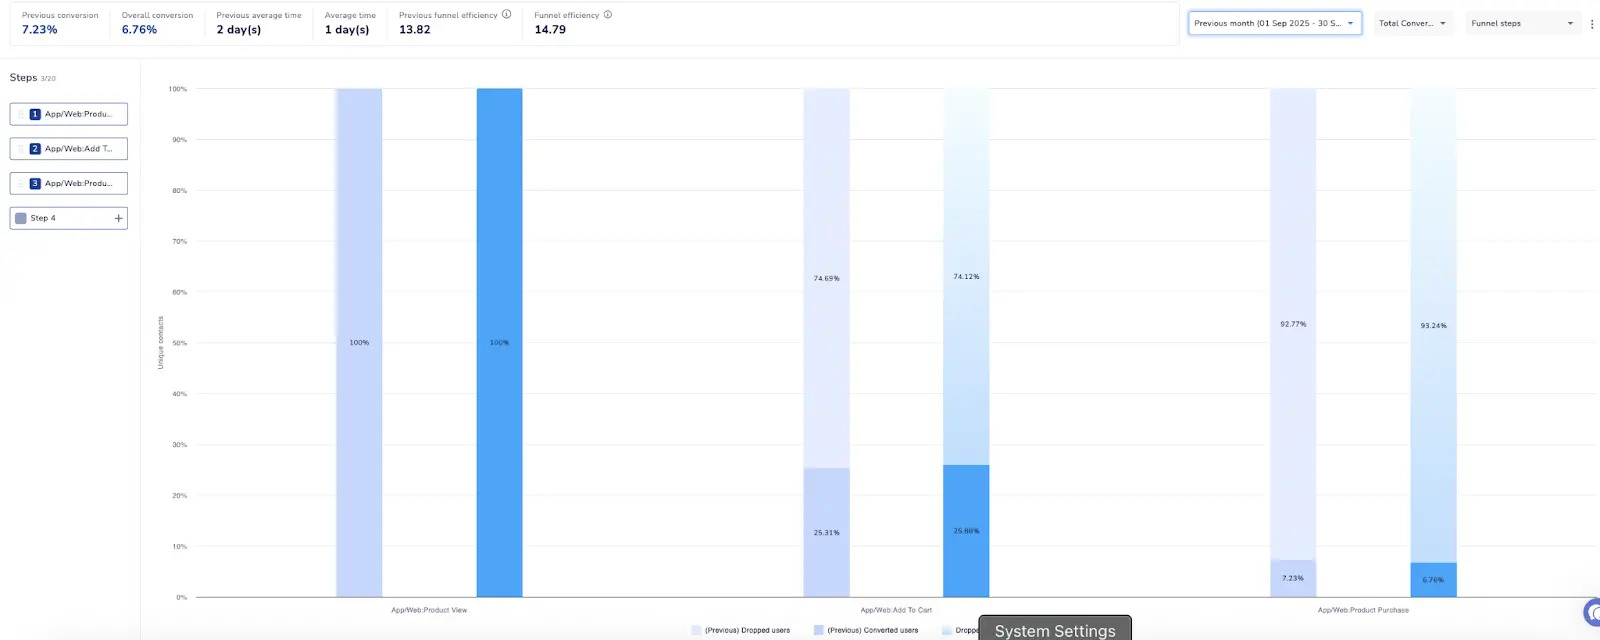
See at a glance:
- Are conversions trending up or down?
- Did that new campaign creative improve performance?
- Which steps are degrading over time?
3. Drill Down Into Who’s Converting—and What They’re Buying
Aggregate funnel data is useful for trends. But optimization requires specificity.
Demographics:
- Age, gender, city, state, country
Technographics:
- Device type (mobile, desktop, tablet)
- Operating system (iOS, Android, Windows)
- Browser
- App version
Activity Payloads:
- Category purchased
- Quantity ordered
- Specific products viewed
Predictive Attributes:
- Predictive CLTV
- Product Affinity
- Category Affinity
- Brand Affinity
- Discount Affinity
- Price Sensitivity
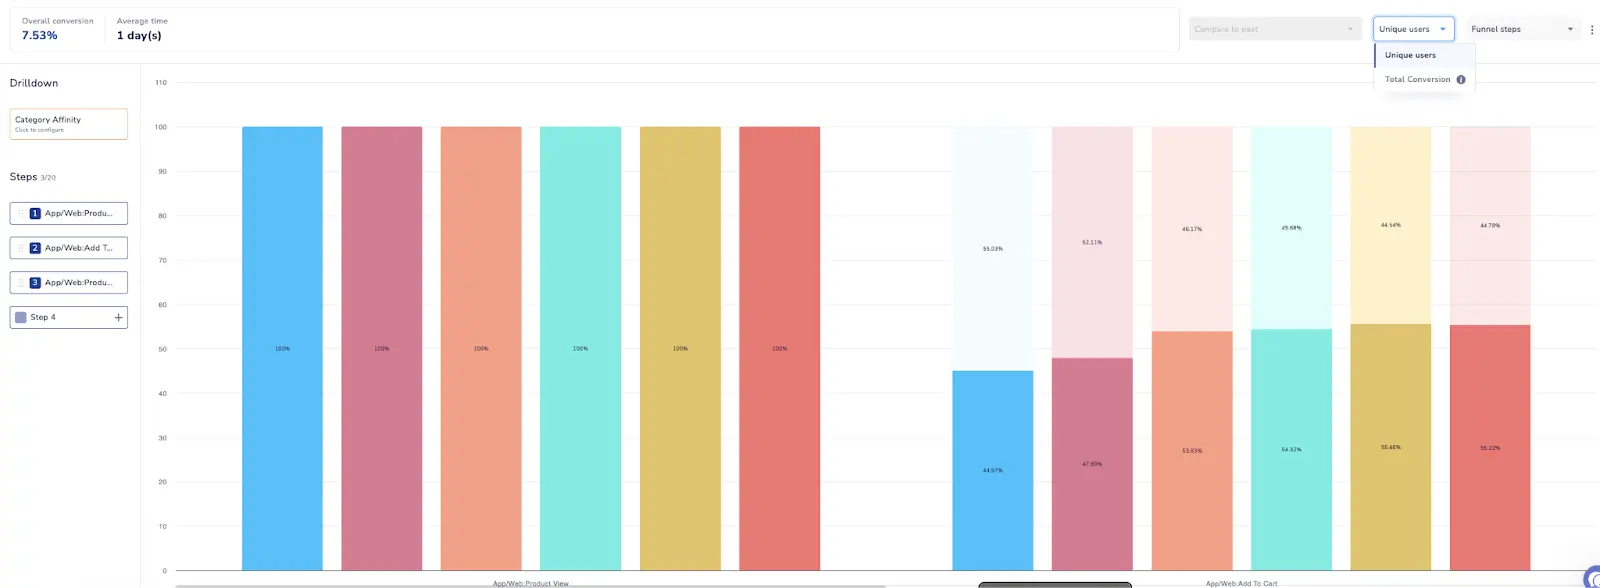
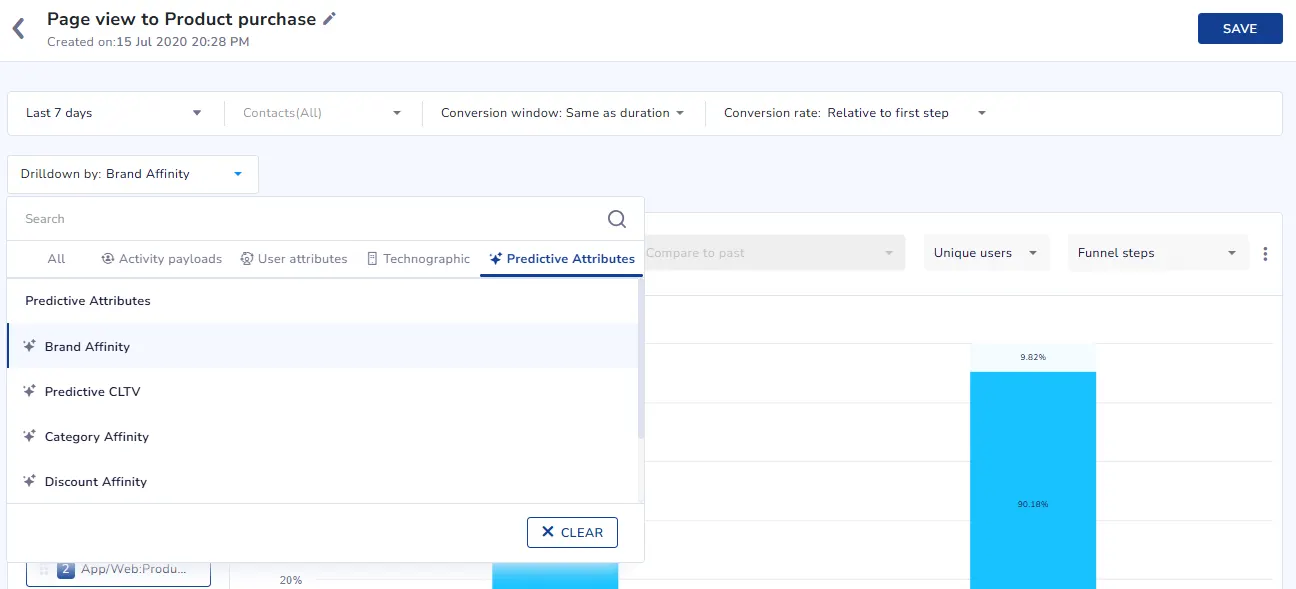
4. Go Beyond Demographics: Drill Down by Affinity
Here’s where Analytics 2.0 gets interesting.
Most platforms let you filter by attributes you already know: age, city, device. But what if you want to see funnel performance by what users are interested in?
Introducing: Affinity Drilldowns
Netcore’s AI automatically clusters users based on their category, brand, and product preferences—without you having to manually build 20+ segment combinations.
In Funnels, you can now drill down by:
- Predictive CLTV: “Users predicted to generate $300+ CLTV in the next 90 days.”
- Category Affinity: “Users interested in Home Decor + Kitchenware”
- Brand Affinity: “Users who prefer Nike + Adidas”
- Product Affinity: “Users browsing Premium Denim + Outerwear”
- Discount Affinity: “Users who only purchase on 20%+ discounts”
- Price Sensitivity: High, Medium, Low price preference segments
Why This Is a Game-Changer:
Instead of stopping at “How many users converted?”, Funnels 2.0 helps you move beyond assumptions and actually see what’s driving results inside your catalog. With granular path-level insights, you can drill directly into the behaviors that reveal your true best-selling categories.
Now you can ask:
- Which product categories convert the fastest—and why?
(Not based on guesswork, but real funnel movement.) - Which categories consistently pull users deeper into the funnel, even if they don’t buy right away?
(Helpful for deciding what to feature or promote.) - Are certain categories attracting low-intent or discount-driven users who slow down the entire funnel?
With this lens, you’re no longer guessing what sells—you’re using high-resolution behavioral data to understand what categories actually perform, and where your merchandising and inventory decisions should go next.
5. Visualize Conversion Trends Over Time
Beyond static funnel charts, Analytics 2.0 provides Conversion Trends—a line graph view that shows how conversions are trending day-on-day, week-on-week, or month-on-month for your selected timeframe.
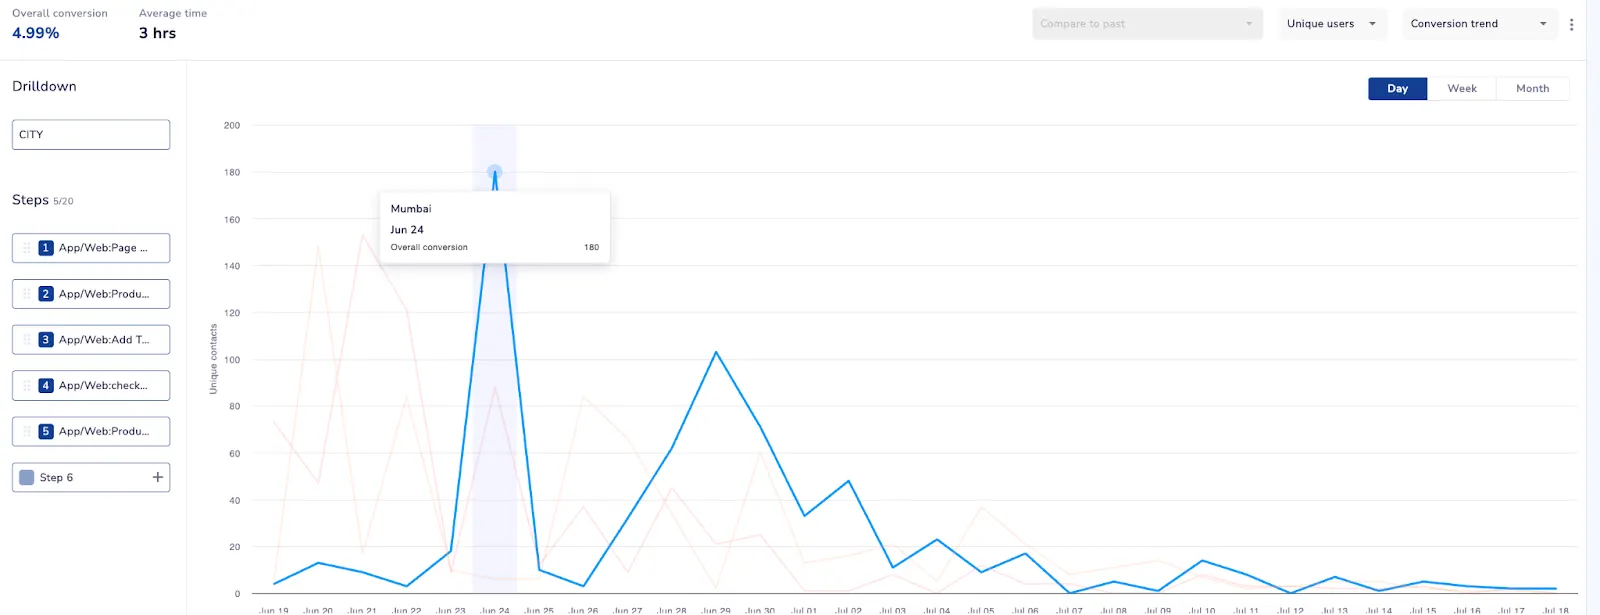
Key Benefits:
- Spot seasonal patterns in conversion behavior
- Validate whether campaign optimizations are working
- Identify when conversion rates start to decline (campaign fatigue, creative burnout)
- Track average conversion rates across your entire funnel
Use It To:
- Monitor real-time campaign performance
- Compare conversion velocity between different user segments
- Set up alerts when conversion rates drop below benchmarks
Detailed Performance Tables:
Every funnel view includes a comprehensive performance table showing average rates, total conversions, and efficiency ratios at each step—giving you both the big picture and granular details in one view.
Case Study: Pepe Jeans Boosts WhatsApp Efficiency by 57% and Achieves 12.8X ROI
Challenge
Pepe Jeans was investing heavily in WhatsApp campaigns, but the performance wasn’t keeping up with the cost. Their funnel showed a 76:1 delivery-to-conversion ratio—meaning 76 WhatsApp messages had to be delivered before a single conversion happened.
Because their audience targeting relied on broad, surface-level indicators like “last opened” or “add to cart”, their outreach lacked personalization. As a result, conversion rates stayed low and cost-per-conversion kept climbing.
Solution
To fix this, Pepe Jeans adopted a data-first approach using Total Conversions, the Funnel Efficiency Ratio, and Affinity Drilldowns.
Here’s what they did:
- Used Total Conversions and Efficiency Ratios to measure exactly how many attempts each conversion required
- Applied Affinity Drilldowns to uncover product categories with the highest conversion likelihood
- Layered this with RFM segmentation to isolate customers with the strongest buying intent
This shifted their targeting from broad audience blasts to precise segments built on real behavioral data.
Key Insight
The real breakthrough came when they realized that their conversions were consistently coming from just 4–5 category groups.
By building AI-based affinity segments, Pepe Jeans transitioned from intuition-driven marketing to data-driven precision. Every message became more relevant—and far more likely to convert.
Actions Taken
- Analyzed funnels through category affinity to pinpoint high-performing segments
- Tracked funnel efficiency month over month to measure improvements
- Combined affinity insights + RFM to form laser-focused customer groups
- Added AI-powered Send Time Optimization, ensuring messages reached users at the moment they were most likely to engage
Results
- 57% improvement in funnel efficiency
→ Ratio improved from 76:1 to 33:1 between June and September - 2.6X increase in conversions
- 11X ROI on WhatsApp and 13X ROI on email in Q3 2024
- 1.8X lift in engagement across read, open, and click metrics
Customer Testimonial
“Partnering with Netcore helped us move from broad targeting to precision marketing. The combination of RFM, AI, and funnel analytics gave us deeper customer insights and the ability to reach the right users at the right time. The result—higher conversions, better engagement, and smarter campaign efficiency month after month.”
— Ashutosh Patkar, Sr. Manager Ecommerce, Pepe Jeans
Case Study: Pepe Jeans Uses Cohorts + Funnels to Drive Repeat Purchases
Challenge
Pepe Jeans struggled with low repeat purchase rates. Without RFM or cohort tracking, they couldn’t distinguish one-time buyers from loyal customers, making it difficult to build retention strategies or identify growth opportunities.
Solution
They combined three Analytics 2.0 modules—Cohorts, Funnels, and RFM—to build a complete understanding of customer retention behavior.
- Cohort Analysis revealed how often customers repurchased week after week
- Affinity Drilldowns highlighted which product categories drove repeat interest
- RFM segmentation helped prioritize top-value customers for retention-focused campaigns
This created a personalized retention strategy grounded in actual customer behavior.
Key Insight
Using Netcore’s Cohorts module, Pepe Jeans discovered which RFM segments were most likely to repurchase and which category affinities drove repeat buying behavior.
For the first time, they could match what users were buying with when they were likely to buy again.
Actions Taken
- Mapped repeat purchase patterns using Cohorts
- Layered category affinity insights to understand what repeat buyers cared about
- Built targeted reactivation campaigns for high-value RFM segments
- Designed personalized retention journeys centered around category preferences
Results
- Higher retention and repeat purchase rates
- 2.6X uplift in conversions for repeat purchase campaigns
- Direct contribution to 12.8X overall ROI across multi-channel campaigns
Cross-Module Impact
This case demonstrates how Analytics 2.0 modules work better together:
- Funnels identified high-converting categories
- Cohorts revealed weekly repeat purchase cycles
- RFM prioritized customers likely to repurchase
Together, these insights delivered a 360° view of customer behavior—something no single module could achieve on its own.
Common Use Cases for Funnels Across Industries
Ecommerce
- Track how many product views / emails / WhatsApp messages it takes before a purchase
- Drill down by price range to optimize discount strategies
- Compare category performance week-over-week to spot trends
FinTech
- Measure onboarding friction (Install → Registration → KYC → Application)
- Compare campaign efficiency across quarters to validate optimizations
- Drill down by source (UTM) to identify high-performing channels
Travel
- Analyze booking funnels by destination preference
- Compare first-time vs repeat travelers’ conversion paths
- Measure efficiency of reminder emails for abandoned bookings
What’s Next: Analytics 2.0 Roadmap
Funnels are just the beginning. Over this quarter, we’re rolling out:
RFM (Recency, Frequency, Monetary) — Automatically segment users by engagement and value
Cohorts 2.0 — Analyze retention, repeat purchases, and churn with AI-powered segment comparisons
User Path Analysis — Visualize every journey users take, not just the ones you designed
Cross-Module Insights — Connect Funnels + Cohorts + Paths to see the complete picture
Get Started with Analytics 2.0 Funnels
For Existing Netcore Customers
Analytics 2.0 Funnels is rolling out now. Contact your Customer Success Manager to:
- Enable the new features in your account
- Schedule a personalized walkthrough
- Get optimization recommendations for your top funnels
New to Netcore?
See how Analytics 2.0 works with your data:
- Schedule a personalized demo with sample data from your industry
- Get a free funnel audit to identify quick wins
