
[Part 1] How To Setup Prometheus And Exporters For Alerts And Monitoring?

Published on 2019-08-29· Updated on 2024-01-25
The author voluntarily contributed this tutorial as a part of Pepipost Write to Contribute program.
Introduction
As a developer, you would often find yourself concerned about the operational status of your services. If you're also responsible for server infrastructure, you might worry about factors like RAM and disk utilization, as well as the risk of system overload leading to downtime. Monitoring these basic metrics is just the tip of the iceberg, with numerous other parameters requiring constant attention in daily operations.
Manually monitoring all these variables around the clock can be quite challenging. This tutorial will guide you through setting up Prometheus as a versatile monitoring system to simplify the process. You will also learn how to use its exporter to specify and retrieve the metrics for tracking.
What is Prometheus
Prometheus is an open-source monitoring and alerting toolkit designed for reliability and scalability. It is used for collecting and storing time-series data, particularly metrics about various aspects of your systems and applications. Prometheus provides a flexible query language, powerful alerting capabilities, and various integrations to help monitor and manage the health and performance of your infrastructure and services. Get more details here.
Prometheus scrapes the data with the timestamp, which can be stored on a server and accessed using the PromQL. Prometheus has a superb support API, making it easy to integrate with any resource in the data center. Prometheus includes third-party libraries that make it more powerful.
Why Prometheus Monitoring?
- It is open-source and available for free.
- It is stable and used by many reputed brands. For example, Stackshare.
- Good community support and well-documented.
- You do not need heavy infrastructure to get started. It just needs 1 GB RAM.
- Prometheus Grafana: While Prometheus has its own UI to check metrics, many prefer Grafana with Prometheus, which gives you better visualization of the metrics.
- Several pre-build Grafana dashboards and exporters are available for reuse.
- You can check the list of Prometheus features here.
Prerequisites for setting up Prometheus monitoring
Prometheus can be installed and tested on a server with a minimum configuration of:
- 1 GB RAM
- 10 GB Average local disk storage
- GOLANG (go1.11.5 Linux/AMD64)
- Centos7 RHEL
Setup Prometheus
Installation
There are multiple ways to install Prometheus. You can use Prometheus docker image or any of the configuration management systems like Ansible, Chef, puppet, and SaltStack. For more information, visit the official installation guide here.
Prometheus Docker Image
Here is the link to download the docker image for Prometheus.
It also contains pre-compiled binaries and is one of the easiest methods to set up.
Step 1:
Visit the Prometheus download page. You will see a list of pre-compiled binaries for Linux, and Windows that you can download according to your OS. The installation for Linux OS is explained below.
OR
You can execute the below command in your Linux terminal:
wget https://github.com/prometheus/prometheus/releases/download/v2.11.1/prometheus-2.11.1.linux-amd64.tar.gz
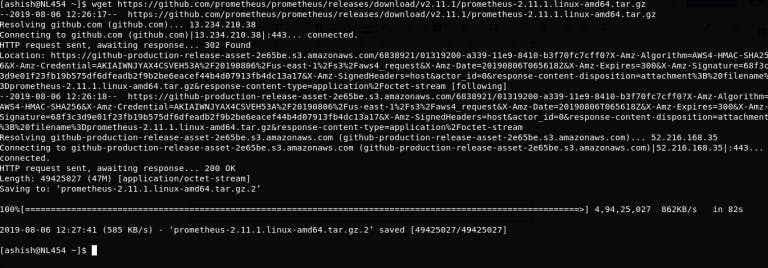
You will see a file with name prometheus-2.11.1.linux-amd64.tar.gz will get downloaded.
Step 2: Extract The Tar
tar -xvzf prometheus-2.11.1.linux-amd64.tar.gz
Step 3: After Extraction Steps
$ mv prometheus-2.11.1.linux-amd64 prometheus
$ cd prometheus/$ ll
Folder contains below file:
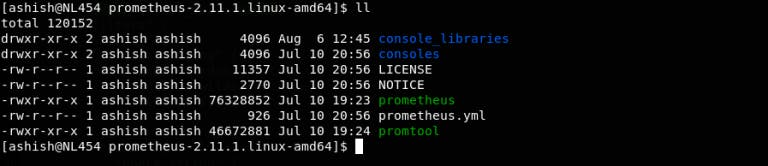
- prometheus: A binary file that is the core daemon.
- prometheus.yml: The config file for the Prometheus service.
- protocol: Another binary file that is used to compile the alert rules file.
Step 4: Execute The Binary File Using The Below Command:
./prometheus
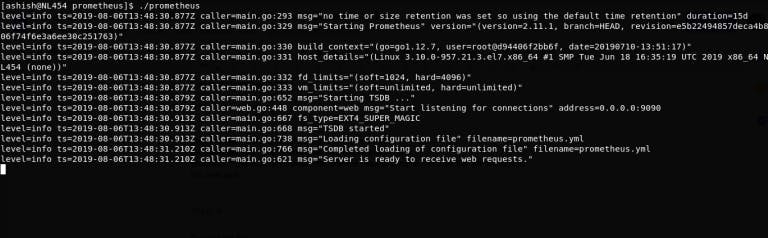
Visit localhost:9090 on your web browser:
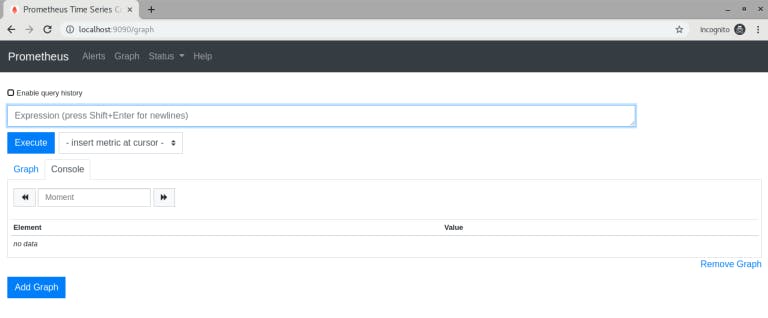
Your Prometheus should be up and running now.
In the prometheus/ folder, you will notice a folder named ‘data.’ Prometheus stores metrics in this ‘/data’ folder.
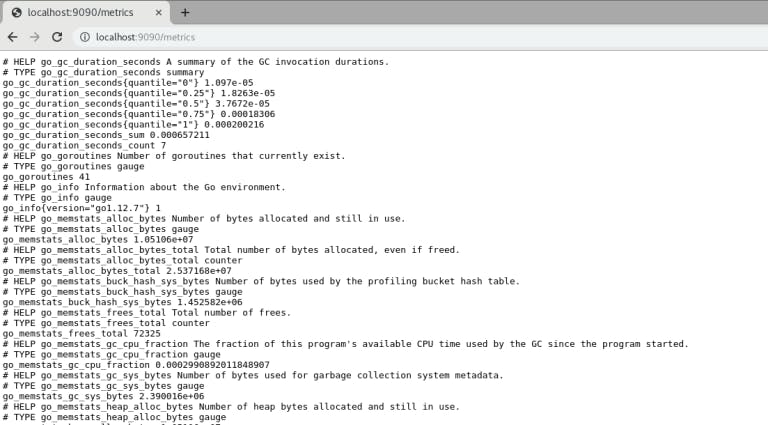
You can get all metric lists by hitting the URL to localhost:9090/metrics.
Prometheus stores its data on disk in a custom time-series format, and it relies on LevelDB as its underlying storage engine. LevelDB is a high-performance, lightweight key-value storage library developed by Google. This combination of Prometheus's custom time-series format and LevelDB as the storage engine enables efficient and scalable storage and retrieval of time-series data, making it suitable for monitoring and alerting purposes. You can check more details on storage.
Here is a sample production command:
~/prometheus/prometheus --storage.tsdb.path=/var/lib/prometheus/data/ --web.external-url=http://myurl.com:9090
--storage.tsdb.path: Specify the path where you want to save Prometheus data.
--web.external-url: You can use this option if you want to bind your address with your URL.
You may get the below error if your folder doesn’t have appropriate permission:
level=error ts=2019-08-06T14:25:19.791Z caller=main.go:731 err="opening storage failed: lock DB directory: open /var/lib/lock: permission denied"
You can try appending “sudo” to your command OR you can give appropriate permission to your folder.
Step 5: Run Prometheus As A Service.
1) Create a file:
/etc/systemd/system/prometheus.service
2) Just paste below code:
[Unit]
Description=Prometheus Server
Documentation=https://prometheus.io/docs/introduction/overview/
After=network-online.target

[Service]
User=root
Restart=on-failure

#Change this line if you download the
#Prometheus on different path user

ExecStart=~/prometheus/prometheus --storage.tsdb.path=/var/lib/prometheus/data/ --web.external-url=http://myurl.com:9090

[Install]
WantedBy=multi-user.target
Save and exit.
3) Reload the Systemctl Daemon:
sudo systemctl daemon-reload
4) Start the Prometheus service:
sudo systemctl start prometheus
Till now you learned how to do basic Prometheus setup. Now, you will learn, how to set up Prometheus exporter.
Prometheus Exporter Setup
What Is Exporter?
EExporters can be any scripts or services that will fetch specific metrics from your system and provide data in Prometheus format. There are two primary methods for fetching and storing metrics in Prometheus:
- Exporter Method: In this approach, a separate exporter service runs on a specific port. When Prometheus queries the exporter's URL at that port, the exporter provides the metrics in Prometheus format. This is a common way to collect metrics from various services and applications. For example, you can set up the Node Exporter to expose system-level metrics to Prometheus, and Prometheus scrapes these metrics at regular intervals.
- Push Method: Alternatively, you can write a script or application that pushes metrics as time-series data directly to the Prometheus server. This method is useful for collecting metrics that cannot be scraped using the exporter approach. It allows you to push custom metrics or data from applications that Prometheus cannot directly scrape. More information on this method can be found in the documentation.
Both methods provide flexibility in collecting and storing metrics, depending on your specific monitoring needs and the nature of the data you want to track.
Now let us set up a node exporter to fetch your server metrics such as RAM/DISK/CPU utilization, network, io, etc.
Node Exporter Setup
Step 1: Download The Binary File And Start Node Exporter:
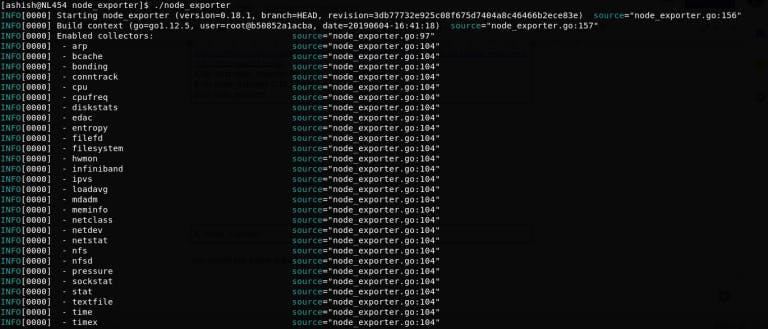
$ wget https://github.com/prometheus/node_exporter/releases/download/v0.18.1/node_exporter-0.18.1.linux-amd64.tar.gz
$ tar -xvzf node_exporter-0.18.1.linux-amd64.tar.gz
$ mv node_exporter-0.18.1.linux-amd64 node_exporter
$ cd node_exporter
$ ./node_exporter
You should be able to see the below output once the node exporter starts:
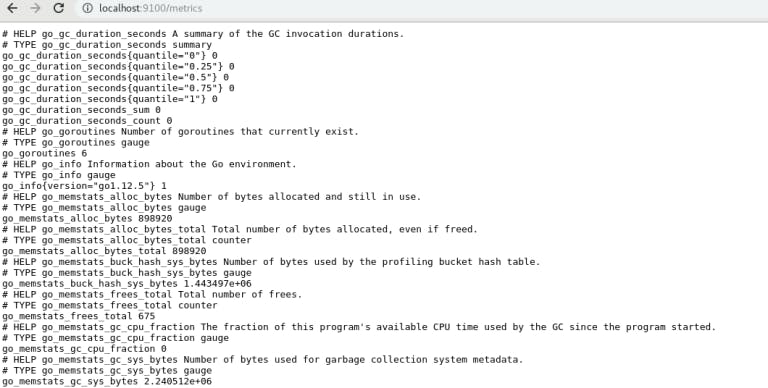
Just visit to localhost:9100/metrics
Step 2: Let's Run Node Exporter As Service:
Create a file in below path:
/etc/systemd/system/node-exporter.service
Just paste below code:
[Unit]
Description=Node exporter
After=network-online.target

[Service]
User=root
Restart=on-failure

#Change this line if you download the
#Prometheus on different path user
ExecStart=~/node_exporter/node_exporter

[Install]
WantedBy=multi-user.target
Reload the systemctl daemon:
sudo systemctl daemon-reload
Start the Prometheus service:
sudo systemctl start node-exporter
Step3: You Are Set With Node Exporter. Now In Prometheus, We Need To Configure This Node Exporter Reference So That Prometheus Can Collect Metrics From This Exporter.
Open file ~/prometheus/prometheus.yml add below configuration:
scrape_configs:
 # The job name is added as a label job=<job_name> to any timeseries scraped from this config. - job_name: 'prometheus' # metrics_path defaults to '/metrics' # scheme defaults to 'http'. static_configs: - targets: ['localhost:9090'] # Add below block for node_exporter - job_name: node_exporter scrape_interval: 1m scrape_timeout:  1m metrics_path: "/metrics" static_configs: - targets: ['localhost:9100']
Save and exit.
- job_name: You can give any name to your scrape job.
- scrape_interval: Interval in which Prometheus will scrape the metrics from the specified URL.
- scrape_timeout: If your exporter has taken more than 1 minute to scrape the metrics, it will be a timeout.
- metric_path: your endpoint’s path (i.e. localhost:9100/metrics)
- targets: the number of servers on which node exporter runs with the same configuration.
Step 4: Here's The Command To Execute Prometheus:
~/prometheus/prometheus --storage.tsdb.path=/var/lib/prometheus/data/ --config.file=~/prometheus/prometheus.yml --web.external-url=http://myurl.com:9090
Also, don’t forget to make the same changes in your service file:/etc/systemd/system/prometheus.service
Step 5: Run This Code
sudo systemctl restart prometheus
Step 6: Visiting Localhost:9090 Again
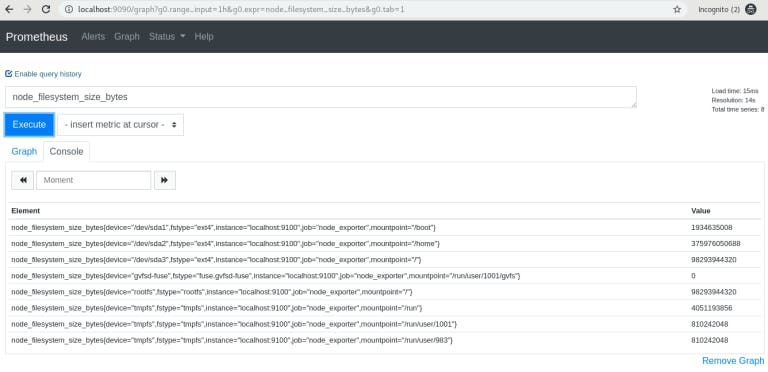
Now visit the URL localhost:9090. In the expression field, you can search for “node_filesystem_size_bytes” by clicking on the “Execute” button. You will get the below stats:
After clicking on the graph:
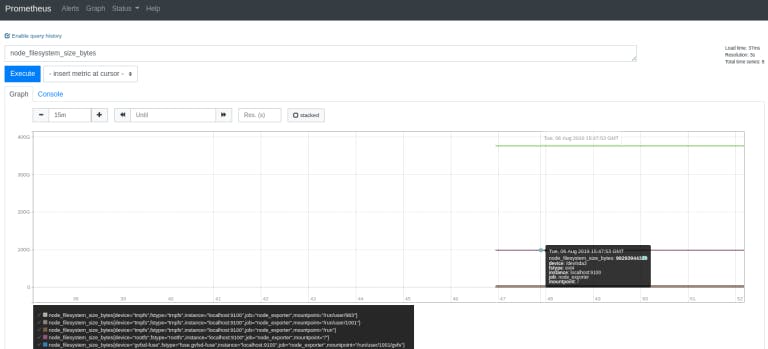
You can explore each metric, such as memory, CPU, etc., similarly.
There are several exporters available on the internet, like Nginx exporter, MongoDB exporter, MySQL server exporter, etc. which you can download and use. You can get more info about such exporters here.
You have now successfully installed Prometheus and node exporters.
This official architecture diagram shows a successful setup of Prometheus, Pushgateway/Exporters, and Prometheus UI.
In the next part, we will explain the setting up of an alert manager and alerts over the metrics.
Note: Prometheus is a storage system for metrics. Therefore, we do not recommend storing any kind of logs in it.
Excited about the latest in Bulk Email Marketing! Check out this insightful blog on Gmail and Yahoo updates in the email marketing landscape.
Explore the Blog - Here
Stay ahead of the game with valuable insights on optimizing your email campaigns! 📬
Grade My Email
Check your spam now?
Netcorecloud's toolkit is the solution to all your email problems.


You can also explore
Netcore connects & unifies your data across all sources, connects to your marketing channels and provides you with control over AI Powered automation and personalization.


Deploy emails that are
screenshot worthy!

Unlock the Secrets of Your Domain, Discover Limitless Possibilities! ✨
Get a Free Domain Health Check Now!

Ashish Tiwari
Open source guy | Linux lover | Dev evangelist @ Pepipost